If investors have really been concerned about the threat of a potential trade war between the U.S. and China, the S&P 500 will very likely let us know how concerned they've been about it this week.
That's because investors continually absorb new information about the business prospects for the companies, where changes in the expectations for their future earnings are quickly realized in their stock prices. For trade-dependent industries, those changes in expectations can show up in the form of lowered expectations for future earnings, which would tend to lower the value of their stock, while industries that might materially benefit from the imposition of new or higher tariffs will have raised expectations for their future earnings, which would tend to increase the stock prices of firms in the "protected" industries.
All that is highly relevant going into the fourth week of May 2018 because of news reports that came out over the weekend indicating that a potential breakthrough in trade negotations between the U.S. and China has been made, which would avert the negative impact of tit-for-tat tariffs and other trade sanctions between the world's two largest national trade partners.
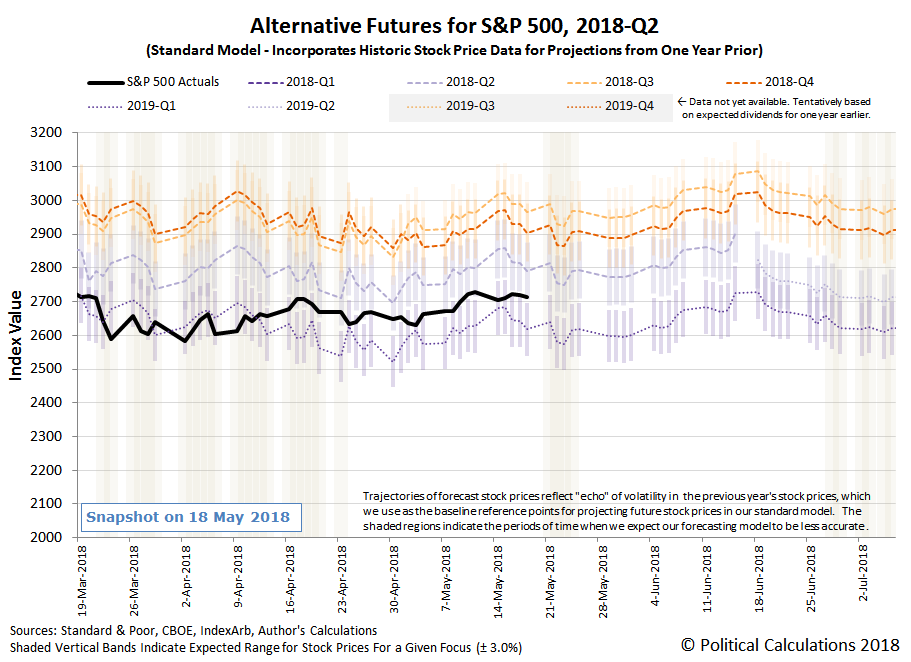
Since the impact of a trade war is generally believed to offer greater negatives than positives across the entire U.S. economy, the diminishment of the risk of trade war should generally boost stock prices, which we would see in the S&P 500. Since the news broke over the weekend, when markets were closed, we would anticipate seeing stock prices (and stock price futures) gap significantly upward as investors provide their initial response to the positive news when markets open for trading on Monday, 21 May 2018. The following spaghetti forecast chart shows where stock prices stood at the close of trading on Friday, 18 May 2018.
The better question to ask is how of that positive change will remain at the close of trading, after investors will be flooded with new information about the potential trade deal and whatever other market moving new information comes out during the day.
At present, our spaghetti forecast chart indicates that the S&P 500 is poised where investors would appear to be roughly equally splitting their forward-looking focus between the current quarter of 2018-Q2 and the more distant future quarter of 2019-Q1. If the news of the potential breakthrough in trade negotiations between the U.S. and China holds, and if the risk of a trade war breaking out between the U.S. and China have been greatly weighing on their expectations for the future, it would be reasonable for investors to shift more of their attention on the current quarter of 2018-Q2 in response to this news and send stock prices upward from their current position, where a single-day increase of 3% or more in response to the news would be relatively easy for the market to achieve.
Such a move would also mark a very rare event for the U.S. stock market. For our daily trading records that extend back to 3 January 1950, covering some 17,207 trading days, we count just 104 where the S&P 500 and its predecessor indices closed higher by 3.0% or more, suggesting historical odds of 1 in 165 for such an event, where we have to go back to 26 August 2015 to find the last such occurrence.
Or, it may not change by such an unusually large amount, which will tell us that investors haven't really been all that concerned about the prospects for an economy-damaging trade war between the U.S. and China, where it has only contributed to the regular daily noise of trading in the U.S. stock market.
The cool thing is that we'll find out the answer, either way, perhaps as early as today from the day's news headlines. Speaking of which, here are the major headlines that we made special note of during the past week....
- Monday, 14 May 2018
- Oil gains while U.S. crude's discount to Brent deepens
- Fed's Bullard says U.S. yield curve might invert by early 2019
- Maybe if he asks nicely? Fed's Kaplan says prefers that U.S. yield curve not invert
- Fed's Kaplan sees U.S. inflation rising but not 'running away'
- China says will work with U.S. for positive outcome in trade talks
- Wall St. ekes out gains as trade optimism pressured by defensive stocks
- Tuesday, 15 May 2018
- NAFTA nations 'very close' to agreeing deal: Canadian prime minister
- At top of Fed, a dispute on policy picks up steam
- Fed's policy language 'served its purpose,' will need revisit: Williams
- Fed's Williams sees no rise in neutral rate from stronger growth
- Bullard says Fed's inflation framework warrants review
- Wall St. drops as Treasury yields surge
- Wednesday, 16 May 2018
- Thursday, 17 May 2018
- Oil steady after retreating from 2014 highs on dollar strength
- Trade Wars not looking so warlike:
- China does not want to see escalation in Sino-U.S. trade tension
- China vice premier says proactively seeking resolutions on trade dispute with U.S.: Xinhua
- White House adviser expects China to bring proposal to trade talks
- China said to offer $200 billion U.S. trade deficit reduction package
- Fed's Kaplan: U.S. economy at or beyond full employment
- U.S. 30-year mortgage rates hit 7-year peak: Freddie Mac
- Tax cut windfall seen lifting U.S. companies' business investments
- Wall St. ends down slightly on trade, oil price concerns
- Friday, 18 May 2018
- Oil prices fall, Brent set for sixth week of gains
- Trade Wars looking like some kind of negotiation:
- Wall Street posts weekly loss as banks, chipmakers weigh
- Over the Weekend
Looking beyond these headlines, Barry Ritholtz listed the positives and negatives for the U.S. economy and markets during the third week of May 2018.
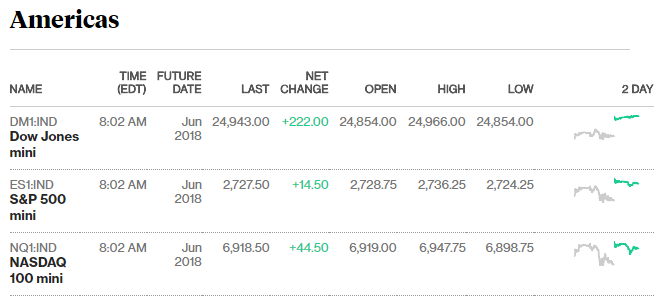
Update 8:15 AM EDT: As expected, pre-market open stock price futures have gapped up, but by 0.6% for the S&P 500.
Update 22 May 2018: By the end of the day, the gain was just a little over 0.5%, with a relatively low level of trading noise throughout the day.
Welcome to the blogosphere's toolchest! Here, unlike other blogs dedicated to analyzing current events, we create easy-to-use, simple tools to do the math related to them so you can get in on the action too! If you would like to learn more about these tools, or if you would like to contribute ideas to develop for this blog, please e-mail us at:
ironman at politicalcalculations
Thanks in advance!
Closing values for previous trading day.
This site is primarily powered by:
CSS Validation
RSS Site Feed
JavaScript
The tools on this site are built using JavaScript. If you would like to learn more, one of the best free resources on the web is available at W3Schools.com.


