The fourth and final week of November 2018 saw the S&P 500 return back to the box, so to speak, as investors shifted their forward-looking attention back toward 2019-Q1 in setting current day stock prices.
The "box", of course, being the red-zone indicated in our spaghetti forecast chart that projects the level of the S&P 500 based on how far forward in time investors are looking....
The big news of the week, which prompted the shift in the level of stock prices, was Federal Reserve Chair Jerome Powell's speech to the Economics Club of New York, which investors interpreted as his taking a much more dovish stance than he was indicating in previous weeks, where the Fed is now expected to back off on plans to continue its series of quarterly rate hikes well into 2019.
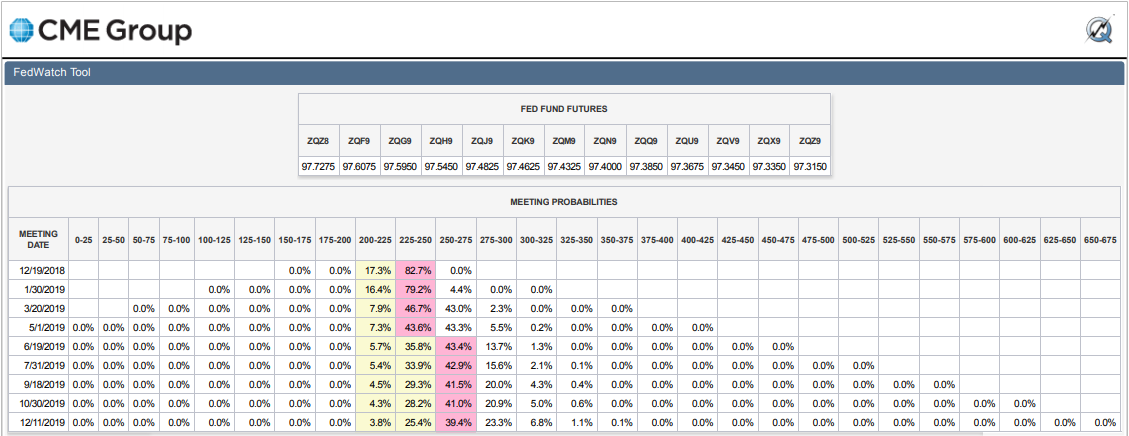
Instead, the CME Group's FedWatch Tool now indicates that after a quarter point rate hike in December 2018, the Fed is now expected to raise short term interst rates in the U.S. just once in 2019, at its June 2019 meeting. The following table shows the probabilities of rate hikes associated with upcoming FOMC meeting dates (please click the image for a larger version):
Looking back at the alternate futures chart for the S&P 500, it's pretty remarkable that the trajectory of the S&P 500 has more closely followed our dividend futures-based model's unadjusted forecast for investors focusing on 2019-Q1. That trajectory only exists because of the echo of the Lévy flight event that took place in early October 2018, without which, and without last week's reaction to Apple's bad news, our standard model's forecast for the S&P 500 with investors focused on 2019-Q1 would have more closely fit within the redzone forecast we added to the chart in early November.
Still, what neither we, nor anyone else, can do is to anticipate the specific news events that might prompt investors to suddenly shift their attention from one point of time in the future to another, which provides much of the genuine randomness that characterizes this portion of the volatility behind changes in stock prices. Speaking of which, here are the more noteworthy news headlines we identified in Week 4 of November 2018.
- Monday, 26 November 2018
- Tuesday, 27 November 2018
- Wednesday, 28 November 2018
- Thursday, 29 November 2018
- Friday, 30 November 2018
- Oil tumbles on supply glut; Wall Street up on G20 comments
- U.S., Canada, Mexico sign trade deal, Trump shrugs off Congress hurdle
- Trump says some good signs on talks with China
- Chinese official says 'consensus steadily increasing' in U.S. trade talks
- Wall Street rises on trade hopes; S&P, Nasdaq post best weeks in 7 years
- After the Friday Close, Before the Monday Open
Over at The Big Picture, Barry Ritholtz has divided the week's major economy and market-related news into six positives and six negatives, covering the week through the market close on Friday, 30 November 2018. He does this every week as an exercise to minimize the effect that his biases may have in affecting his outlook in assessing investments, which is something that we recognize as a valuable service, because we use it for the same purpose. We're happy to feature it each week because it's valuable in maintaining an objective outlook that we find makes it easier to identify new opportunities sooner than we otherwise might, which is a bit like having a super power.
How do you keep from getting trapped after a bias of yours sends you down a blind alley?
Welcome to the blogosphere's toolchest! Here, unlike other blogs dedicated to analyzing current events, we create easy-to-use, simple tools to do the math related to them so you can get in on the action too! If you would like to learn more about these tools, or if you would like to contribute ideas to develop for this blog, please e-mail us at:
ironman at politicalcalculations
Thanks in advance!
Closing values for previous trading day.
This site is primarily powered by:
CSS Validation
RSS Site Feed
JavaScript
The tools on this site are built using JavaScript. If you would like to learn more, one of the best free resources on the web is available at W3Schools.com.

