During the 2018 partial government shutdown, which affected the timely reporting of housing market data, we began exploring alternative sources for that data that are providing a more detailed picture of recent trends in the residential real estate market at the state level than is possible with the data that U.S. government agencies regularly publish.
We're finding Zillow's data for existing home sales to be especially useful, since it covers 41 states and the District of Columbia, where we can get a pretty good idea of individual state-level trends, which we can quantify by the estimated total valuation of existing home sales within these regions.
Take the west coast of the continental United States for example where the three states of California, Oregon, and Washington all fall within the top 10 for having very expensive housing in the U.S., with California ranking second (after Hawaii), Washington ranks sixth, and Oregon ranks eighth in the nation according to the measure of median home values.
.Normally, the closest you can get to the data that applies for the states of Washington, Oregon, and California comes from monthly data published by the National Association of Realtors, which groups these three states in with 10 others as part of the West region, as defined by the U.S. Census Bureau in reporting home sales. Or you might be able to get home sales data for just California from the California Association of Realtors, but good luck finding similar reports for Oregon or Washington....
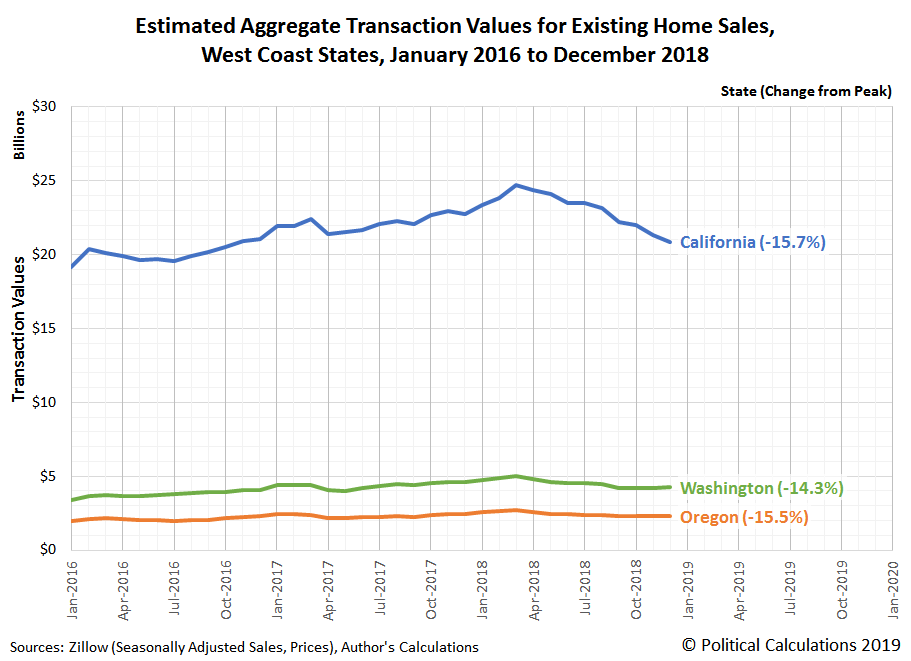
We've used Zillow's data to drill down into the recent history of existing home sales in each of these three states, where we find they share a unique trend that took hold after March 2018. The following chart shows our estimates of the total valuation of existing home sales in California, Oregon, and Washington from January 2016 through December 2018.
All three states saw their seasonally-adjusted total valuation of existing home sales peak in March 2018, where through December 2018, each has experienced a 14-16% decline.
That puts these three states into a unique grouping, where the other states for which we have data range considerably. Some, like North Dakota and Colorado, have seen their total existing home sales valuation drop by more than 20% through December 2018 from their peak values (in March 2017 for North Dakota and in March 2018 for Colorado). Meanwhile, other states had seen no peak as of December 2018, including Michigan, Indiana, Oklahoma, Arkansas, Kansas, and West Virginia.
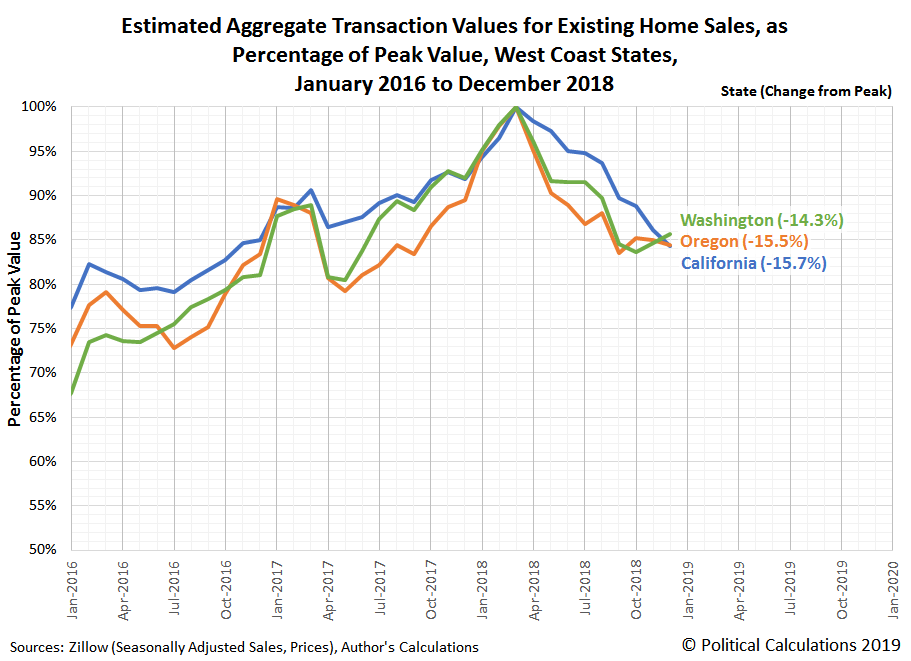
That's a pretty wide range, so to compare how similar the trends have been in Oregon, Washington, and California, we calculated the percentage of the previous peak value of their total existing home sales valuation, which we've presented in the following chart.
Although all three states peaked in March 2018 and have declined by about the same level as of December 2018, we find that the drop-off in existing home sales in Washington and in Oregon have been considerably steeper than what California has experienced. At the same time, both Oregon and Washington are showing potential signs of having reached at least a short term bottom for the declines they have experienced in recent months, while California's trajectory does not yet show such an indication.
There are a lot of potential reasons why that might be, but that's not in the scope for what we're presenting today, where we're demonstrating what's now possible for quantifying and visualizing these state level trends. We'll take on the trends for existing home sales in other states in upcoming months!
Labels: data visualization, real estate
Welcome to the blogosphere's toolchest! Here, unlike other blogs dedicated to analyzing current events, we create easy-to-use, simple tools to do the math related to them so you can get in on the action too! If you would like to learn more about these tools, or if you would like to contribute ideas to develop for this blog, please e-mail us at:
ironman at politicalcalculations
Thanks in advance!
Closing values for previous trading day.
This site is primarily powered by:
CSS Validation
RSS Site Feed
JavaScript
The tools on this site are built using JavaScript. If you would like to learn more, one of the best free resources on the web is available at W3Schools.com.

