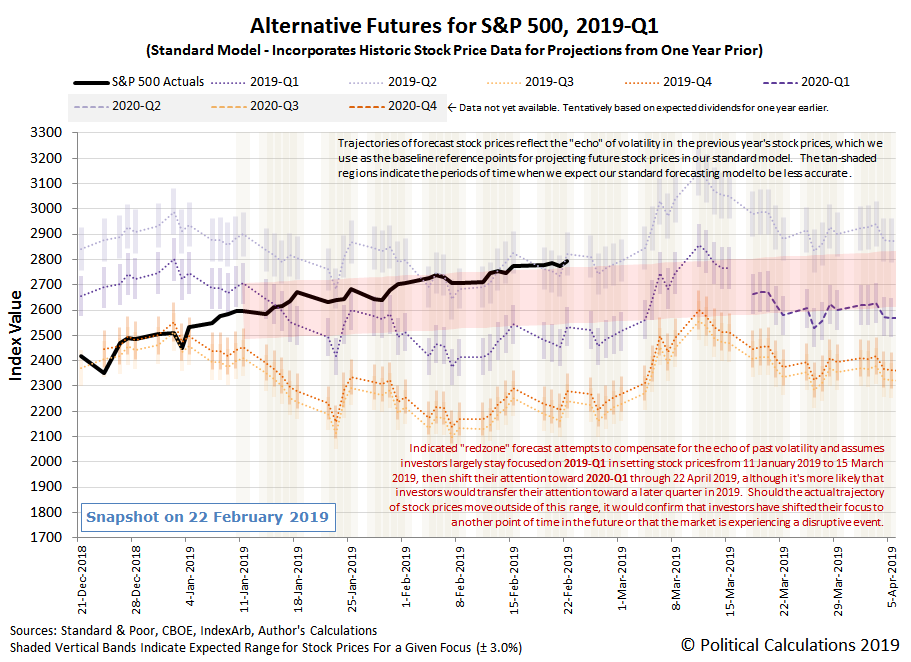
After breaking out above the top end of our redzone forecast range last week, the S&P 500 (Index: SPX) drifted higher through the third week of February 2019, hovering just above it.
As a reminder, the range indicated by the redzone forecast represents where our dividend futures-based model predicts the S&P 500 would go if they were primarily focusing on the current quarter of 2019-Q1 in setting stock prices, which we've added as an adjustment to account for the model's projections being skewed by the past volatility of stock prices that the model uses as the base reference points for its projections into the future. With the S&P 500 having risen above that range, that's an indication that investors have shifted at least part of their forward-looking focus toward another point of time in the future, which our model suggests is 2019-Q2, although it is still much more heavily weighted toward 2019-Q1 at this time. (Although the unadjusted spaghetti forecast chart looks like they are already fully focused on 2019-Q2, if that were really the case, we estimate the S&P 500 would be nearly 150 points higher after accounting for the effect of past volatility on the model's projections!)
As for why they might be shifting their attention toward this particular point of time in the future, we have to turn to the news of the week for context (see below), where the most promising explanation is a potential deal being struck to either end or mitigate the U.S.-China trade war, which if it were made in March 2019, would have benefits start to be recorded during 2019-Q2's earnings season.
- Tuesday, 19 February 2019
- Oil gains as investors grow optimistic over OPEC output deal
- Bigger trouble developing in China: Japan's exports fall most in two years as China shipments weaken
- Bigger stimulus developing in China:
- China unveils plans to develop Greater Bay Area
- China needs tax cuts to relieve pressure on economy: vice premier
- China pledges more support for banks' perpetual bonds to boost lending
- Still in denial: Fed's Mester says higher rates likely needed later this year
- Emerging from denial: Exclusive: Fed's Williams says new economic outlook necessary for rate hikes
- Wall Street rises modestly on Walmart bump
- Wednesday, 20 February 2019
- Oil settles 1 percent higher on hopes of market rebalance, trade deal
- Bigger stimulus developing in China: China to expand agriculture reforms to bolster rural economy
- Fed flags end to balance sheet runoff, patience on rates
- January FOMC minutes: Little risk in pause
- Fed's Daly sees significant economic headwinds, but no recession - but then again, they never do, do they?
- Wall Street ends up slightly as Fed minutes support cautious stance
- Thursday, 21 February 2019
- Bigger stimulus developing in China: Exclusive: China central bank sees benchmark rate cut as last resort, may use other tools - sources
- U.S. existing home sales fall sharply to three-year low
- Exclusive: U.S., China sketch outlines of deal to end trade war - sources
- Wall St. breaks run of gains as economic data disappoints
- Friday, 22 February 2019
- Oil hits 2019 highs on U.S.-China trade hopes, but U.S. output weighs
- Bigger trouble developing in China: China's January home price growth at nine-month low as confidence dips
- Policy changes in the works at the Fed:
- A Fed pivot, born of volatility, missteps, and new economic reality
- Flattening U.S. yield curve in late 2018 'flashing red' on economy: Fed's Williams
- Fed to keep open mind in review of strategy, tools, Clarida says
- Fed eyes end to balance sheet reductions later this year
- Fed's Bullard says not ready to call for another rate cut: Fox Business
- Trade deal getting near?
- Trump says he expects to meet China's Xi soon on trade
- China has agreed to buy up to $1.2 trillion in U.S. goods: CNBC
- S&P 500 posts highest close since November 8 on trade optimism
Barry Ritholtz surveyed the week's markets and economy-related news to identify no fewer than five positives and five negatives for the week that was.
Welcome to the blogosphere's toolchest! Here, unlike other blogs dedicated to analyzing current events, we create easy-to-use, simple tools to do the math related to them so you can get in on the action too! If you would like to learn more about these tools, or if you would like to contribute ideas to develop for this blog, please e-mail us at:
ironman at politicalcalculations
Thanks in advance!
Closing values for previous trading day.
This site is primarily powered by:
CSS Validation
RSS Site Feed
JavaScript
The tools on this site are built using JavaScript. If you would like to learn more, one of the best free resources on the web is available at W3Schools.com.
