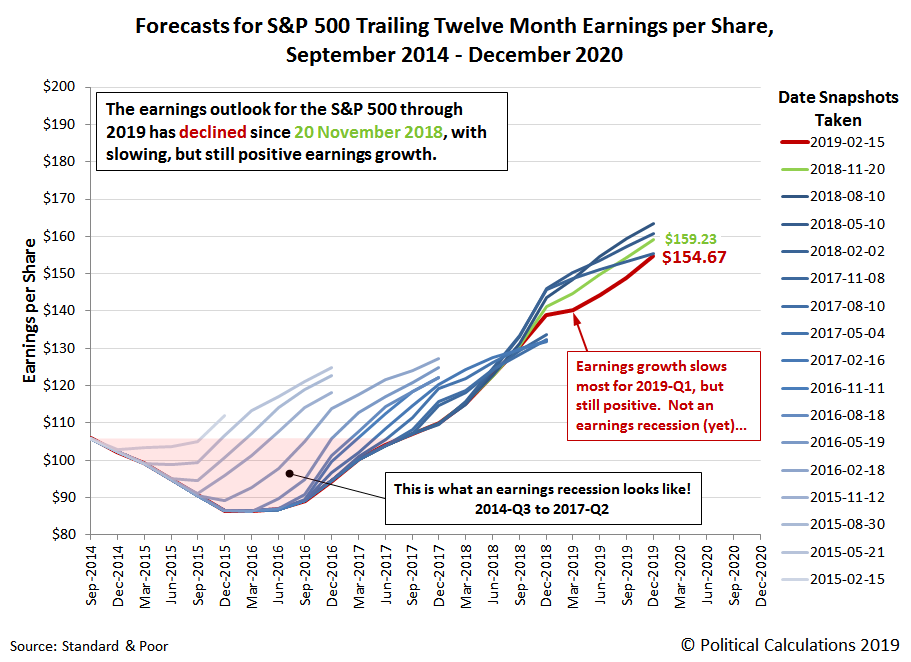
Every three months, we take a snapshot of the expectations for future earnings in the S&P 500 at approximately the midpoint of the current quarter, shortly after most U.S. firms have announced their previous quarter's earnings.
The earnings outlook for the S&P 500 has darkened more since our previous edition, where as of the snapshot available as of 31 January 2019, we find that the projected future for S&P 500 earnings has weakened through the end of 2019, continuing the trend that had been forecast three months earlier.
As of 15 February 2019, S&P projects that trailing year earnings per share through 2019-Q4 will total $154.67, about the same as what they had first forecast for this distant period over a year ago, on 2 February 2018.
Looking at the nearer term future, at present, trailing year earnings per share for 2019-Q1 are still projected to rise above their 2018-Q4 level, so while forecast earnings growth is slowing, it does not yet confirm the arrival of an earnings recession, which occurs when trailing twelve month earnings per share begins to fall after reaching a peak.
In the chart above, we've highlighted the last earnings recession, which began in 2014-Q3 and bottomed in 2016-Q1 before going on to surpass the previous peak in trailing year earnings per share in 2017-Q2. That earnings recession primarily impacted the U.S. oil industry, which was driven by the collapse of global crude oil prices in mid-2014 as Saudi Arabia created a supply glut in the market in an effort to weaken other national competitors, where a recovery didn't begin until those prices finally bottomed in February 2016.
Oil prices have been falling in recent months, although today, that appears to be more the result of a change in the global demand for oil rather than a new surge of supply, where economic growth indicators have been slumping in China and turning negative in the Eurozone.
Boosted by the stimulus of tax cuts, the national U.S. economy appears to have mostly escaped being pulled down toward recession by these global developments in 2018, until perhaps the last months of the year, when the cumulative impact of rising interest rates reversed growth in the U.S. housing sector, followed by the retail sector taking an unexpectedly large hit and auto sales dropping sharply.
With that being the case, many firms in these sectors are now revising their earnings projections downward, which is why the future outlook has darkened for the S&P 500. We expect this process will continue as the higher level of distress in these industries diffuses through other industries over time, slowing the momentum that is so far avoiding the true onset of an earnings recession.
Which is why a number of observers are dreading the official arrival of a new earnings recession, while others are telling investors not to worry yet. We're in a mixed phase right now, where only new information will confirm the direction that earnings per share are headed.
Data Source
Silverblatt, Howard. Standard & Poor. S&P 500 Earnings and Estimates. [Excel Spreadsheet]. 31 January 2019. Accessed 15 February 2019.
Labels: earnings, forecasting, SP 500
Welcome to the blogosphere's toolchest! Here, unlike other blogs dedicated to analyzing current events, we create easy-to-use, simple tools to do the math related to them so you can get in on the action too! If you would like to learn more about these tools, or if you would like to contribute ideas to develop for this blog, please e-mail us at:
ironman at politicalcalculations
Thanks in advance!
Closing values for previous trading day.
This site is primarily powered by:
CSS Validation
RSS Site Feed
JavaScript
The tools on this site are built using JavaScript. If you would like to learn more, one of the best free resources on the web is available at W3Schools.com.
