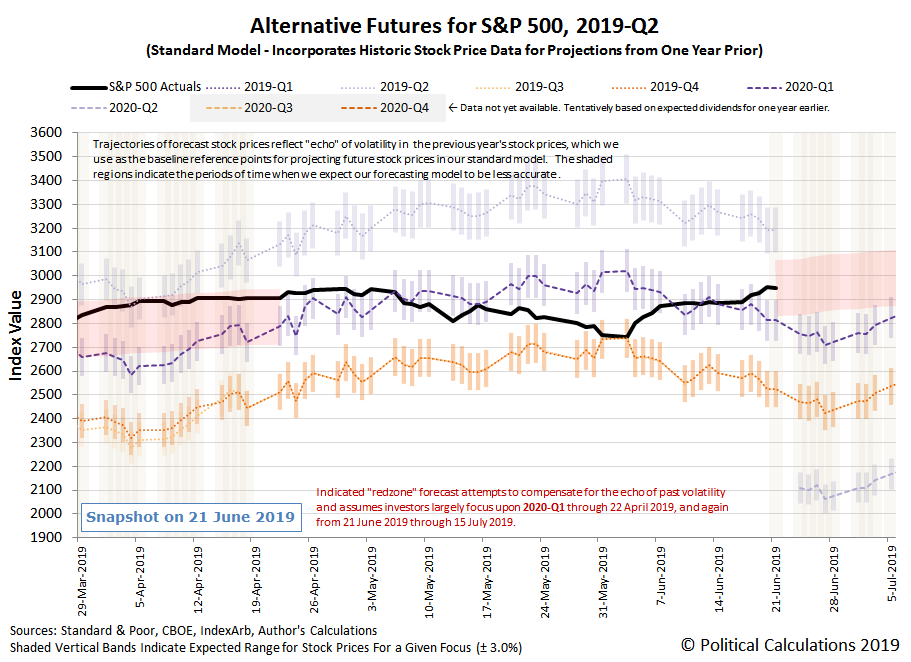
The S&P 500 (Index: SPX) reached new heights in the third week of June 2019 as the U.S. Federal Reserve's signaled it would soon begin slashing its Federal Funds Rate, lifted by the prospects the Fed may implement as many as four rate cuts happening between between the present and the end of the first quarter of 2020.
Although the odds of a Fed rate cut in 2020-Q1 dropped below 50% again on Friday, 21 June 2019, we think the potential for a fourth rate cut in March 2020 will continue to fix investors' attention on this distant future quarter, unless and until they might have a more compelling reason to reset their focus upon a different point of time in the future.
With that assumption in place, we've added a redzone forecast range to our alternative futures spaghetti forecast chart, where we would anticipate the S&P 500 to fall while investors set their focus on 2020-Q1 during the next several weeks while the echo of past volatility in stock prices affects the accuracy of our dividend futures-based model in projecting future stock prices.
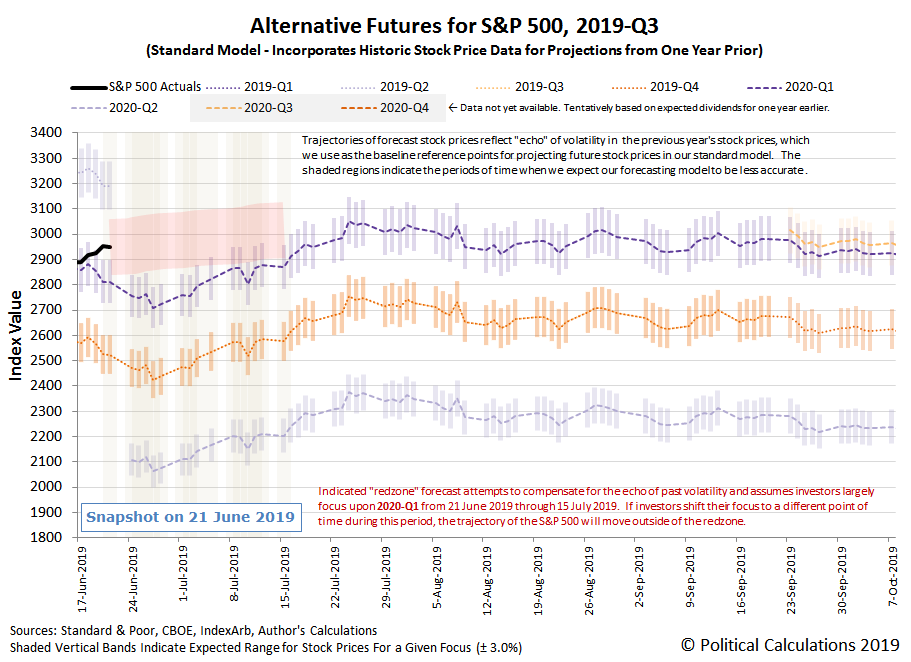
And because we're so close to the end of 2019-Q2, which is already over where the quarter's dividend futures contracts are concerned, we'll take advantage of the opportunity to project the potential futures for the S&P 500 through the end 2019-Q3:
On the whole, the S&P 500 behaved predictably during the third week of June 2019. A big reason why that was the case was the flow of news during the week, where we flagged the following headlines as particularly newsworthy for their market-moving potential.
- Monday, 17 June 2019
- Oil prices fall 1% as economic worries outweigh tanker tensions
- Bigger stimulus developing
in Chinaall over: - China urges big lenders not to shun small non-banks after Baoshang's woes: sources
- China renames, restructures state railway giant in reform push
- Signs China stimulus getting traction: China's home prices growth fastest in five months, raises policy challenge
- Australia's central bank says 'likely' will have to cut rates again
- Faith in the Fed nudges Wall Street higher
- Tuesday, 18 June 2019
- Oil climbs over $1/bbl on U.S.-China trade deal hopes, Mideast tension
- Bigger stimulus developing
in Chinain Eurozone: - Major policy reversal: ECB will provide more stimulus if inflation doesn't pick up: Draghi
- Wall Street nears record as mood on trade again turns optimistic
- Wednesday, 19 June 2019
- Oil prices little changed despite U.S. crude stock draw
- Fed sees case building for interest rate cuts this year
- FOMC statement from June 18-19 meeting
- Instant view: Fed holds interest rates steady, sets up for cuts
- Traders bet heavy on Fed rate cuts ahead
- What changed for the Fed in seven weeks? Trade risks top the list
- Mexico first to ratify USMCA trade deal, Trump presses U.S. Congress to do same
- Stocks approach record as Fed soothes Wall Street's fears
- Thursday, 20 June 2019
- US oil surges 5.4% to settle at $56.65 after Trump says Iran made a ‘very big mistake’
- Bigger stimulus developing all over:
- Worried by US-China trade tensions, ECB considering new stimulus: Olli Rehn
- Indonesia Signals Rate Cut Is Coming Aas It Eases Reserve Ratio
- Australia : Australian shares hit 11-year peak on fresh rate cut hopes, NZ edges down
- Bank of Japan joins Fed, ECB in signaling easing if needed, keeps policy on hold for now
- China, U.S. trade teams to hold talks
- Rate-cut euphoria elevates S&P 500 to record high
- Friday, 21 June 2019
- Oil climbs on Iran tensions, stocks edge back from seven-week highs
- Bigger trouble developing in China:
- China Hit By "Significant Banking Stress" As SHIBOR Plummets To Recession Levels
- From Baoshang to trade wars to local government: Mapping China’s toxic debt
- Bigger stimulus developing in China all over:
- Fed officials face weak inflation, but split over what it means
- Fed's Brainard says risks bolster argument for lower-than-expected rates
- Fed's Kashkari calls for 50 basis point cut in U.S. rates
- Clarida: Outlook is for continued U.S. expansion, but Fed prepared to act
- Fed's Bullard says he dissented at Fed meeting on concerns over weak inflation, growth
- Bang-up week on Wall Street ends with a whimper
At the Big Picture, Barry Ritholtz identified 6 positives and 6 negatives in his review of the week's major economic and market-related news.
The S&P 500 will enter 2019-Q3 relatively near the ceiling for how high it can go with the current expectations for future dividends, which puts it into something of a danger zone. While it has some room to move up from its current record level, events that might cause investors to refocus on the nearer term future would likely coincide with sharp declines in stock prices as 2019-Q3 offers investors heightened risks.
Welcome to the blogosphere's toolchest! Here, unlike other blogs dedicated to analyzing current events, we create easy-to-use, simple tools to do the math related to them so you can get in on the action too! If you would like to learn more about these tools, or if you would like to contribute ideas to develop for this blog, please e-mail us at:
ironman at politicalcalculations
Thanks in advance!
Closing values for previous trading day.
This site is primarily powered by:
CSS Validation
RSS Site Feed
JavaScript
The tools on this site are built using JavaScript. If you would like to learn more, one of the best free resources on the web is available at W3Schools.com.

