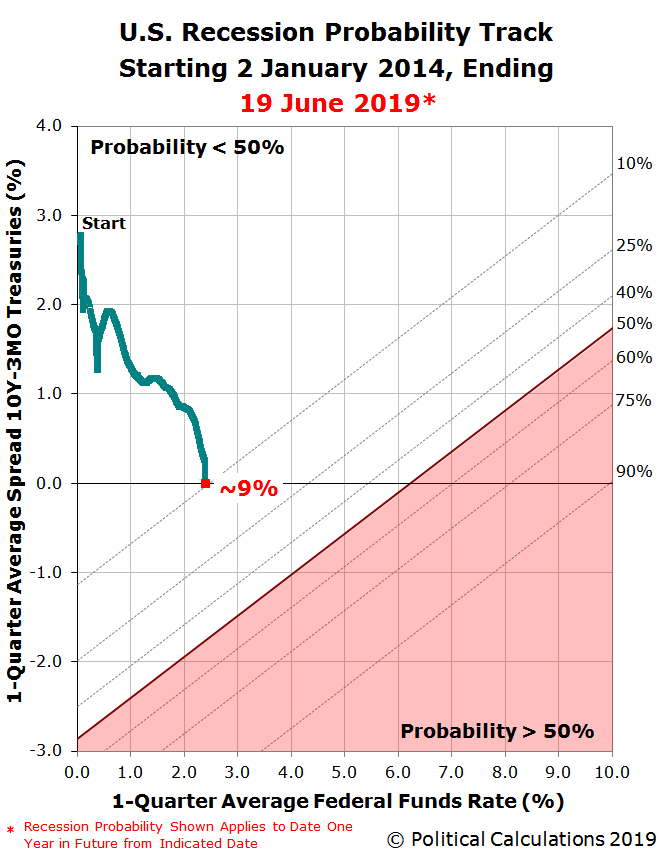
The Federal Reserve chose to leave short term interest rates in the United States unchanged at the conclusion of its fourth two-day meeting of 2019 on 19 June 2019, holding its target range for the Federal Funds Rate between 2.25% and 2.50% for at least another six weeks, when the Fed will meet again to consider cutting the Federal Funds Rate.
According to the CME Group's FedWatch Tool, investors are betting the Fed will cut its Federal Funds Rate by a quarter point, giving a 100% probability of that happening at the next meeting. Following the Fed's June meeting, investors are now also betting the Fed will cut rates by another quarter point at the conclusion of its 18 September 2019 meeting, and again at the conclusion of its 11 December 2019 meeting, putting three rate cuts on tap for the remainder of 2019.
They are also giving a little higher than even-money odds that the Fed will cut rates again in March 2020, which would put the forward-looking focus of investors on that distant future quarter.
As for the odds of recession, there is now a one-in-eleven chance the U.S. economy will enter into a recession sometime between 19 June 2019 and 19 June 2020 (or really, before July 2020). The latest update to the Recession Probability Track shows these odds at roughly a 9% probability.
The Recession Probability Track is based on Jonathan Wright's 2006 paper describing a recession forecasting method using the level of the effective Federal Funds Rate and the spread between the yields of the 10-Year and 3-Month Constant Maturity U.S. Treasuries.
If you would like to run your own recession probability scenarios, please take advantage of our recession odds reckoning tool, which like our Recession Probability Track chart is based on Jonathan Wright's paper.
It's really easy. Plug in the most recent data available, or the data that would apply for a future scenario that you would like to consider, and compare the result you get in our tool with what we've shown in the most recent chart we've presented. We do just that, in fact, when we account the Fed's recent quantitative tightening monetary policies in our in-between Fed meeting updates, which would put the odds of an official period of recession starting before July 2020 much higher than what the "official" Wright methodology indicates.
If you would like to catch up on any of the analysis we've previously presented, here are all the links going back to when we restarted this series back in June 2017.
Previously on Political Calculations
- The Return of the Recession Probability Track
- U.S. Recession Probability Low After Fed's July 2017 Meeting
- U.S. Recession Probability Ticks Slightly Up After Fed Does Nothing
- Déjà Vu All Over Again for U.S. Recession Probability
- Recession Probability Ticks Slightly Up as Fed Hikes
- U.S. Recession Risk Minimal (January 2018)
- U.S. Recession Probability Risk Still Minimal
- U.S. Recession Odds Tick Slightly Upward, Remain Very Low
- The Fed Meets, Nothing Happens, Recession Risk Stays Minimal
- Fed Raises Rates, Recession Risk to Rise in Response
- 1 in 91 Chance of U.S. Recession Starting Before August 2019
- 1 in 63 Chance of U.S. Recession Starting Before September 2019
- 1 in 54 Chance of U.S. Recession Starting Before November 2019
- 1 in 42 Chance of U.S. Recession Starting Before December 2019
- 1 in 26 Chance of U.S. Recession Starting Before February 2020
- 1 in 16 Chance of U.S. Recession Starting Before April 2020
- 1 in 14 Chance of U.S. Recession Starting Before April 2020
- 1 in 13 Chance of U.S. Recession Starting Before May 2020
- 1 in 12 Chance of U.S. Recession Starting Before June 2020
Labels: recession forecast
Welcome to the blogosphere's toolchest! Here, unlike other blogs dedicated to analyzing current events, we create easy-to-use, simple tools to do the math related to them so you can get in on the action too! If you would like to learn more about these tools, or if you would like to contribute ideas to develop for this blog, please e-mail us at:
ironman at politicalcalculations
Thanks in advance!
Closing values for previous trading day.
This site is primarily powered by:
CSS Validation
RSS Site Feed
JavaScript
The tools on this site are built using JavaScript. If you would like to learn more, one of the best free resources on the web is available at W3Schools.com.

