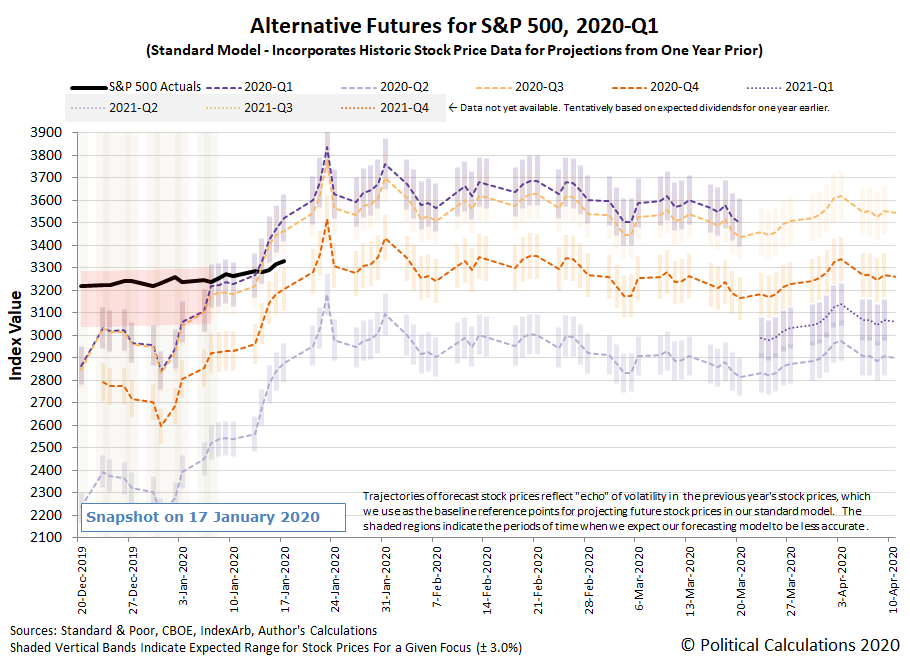
The S&P 500 (Index: SPX) continued its record-setting rally, breaking through the 3,300 level and closing the week at a new record high closing value of 3,329.62. That new record comes as investors appear to be shifting their forward-looking focus, as anticipated, from 2020-Q1 toward 2020-Q4 as indicated on the following chart.
Through the close of trading on Friday, 17 January 2020, the dividend futures-based model that underlies the alternative futures chart above indicates that investors are now dividing their attention between 2020-Q1 and 2020-Q4, with stock prices rising, but not as fast as the model suggests they would have if investors had remained fully focused on 2020-Q1.
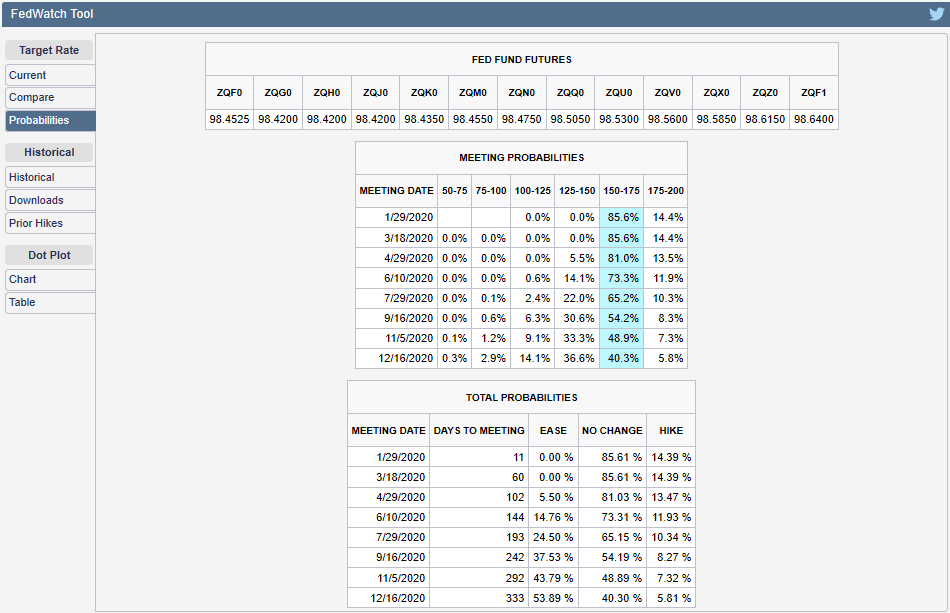
The direction that the S&P 500 will take going forward will depend upon how closely investors might fix their attention on either 2020-Q1 or 2020-Q4 as they make their current day investment decisions, where our thinking is that 2020-Q4 will demand more of their focus given the elevated probability of that more distant future quarter coinciding with the timing of the Federal Reserve's next action for setting short term interest rates in the U.S. The CME Group's FedWatch tool continues to show investors are giving better-than-even odds of a quarter point rate cut taking place during 2020-Q4.
On a side note, we often describe shifts in the forward-looking focus from one point of time in the future to another as the quantum part of the quantum random walk that stock prices periodically follow. Unlike the nearly instantaneous quantum leaps that take place with subatomic particles however, stock prices tend to take somewhat longer to move from one alternative trajectory to another, which we have come to associate with stock prices undergoing a Lévy flight phenomenon. The often outsized changes that take place at these times are what give stock prices their fat-tailed distributions, where large changes in stock prices occur more often than would be predicted by a normal distribution.
This latest shift qualifies as the S&P 500's latest Lévy flight event, although in this case, even though there is a comparatively large gap between the alternative trajectories associated with investor expectations for 2020-Q1 and 2020-Q4, the alternative trajectories the describe the potential paths the S&P 500 might follow are such that the overall change in stock prices will be considerably smaller than it would otherwise have been if the timing of the shift in investor focus had occurred either a week earlier or a week later. In a sense, the S&P 500 is following a path that takes the least amount of energy for it to follow as it transitions from one level to another.
Let's get to the news of the week that was. The following headlines capture the more significant market-moving events that occurred during the second full week of January 2020.
- Monday, 13 January 2020
- Crude exports boom on U.S. Gulf Coast, allaying bottleneck fears
- Fed's Rosengren warns of inflation risks to central bank's 'almost ideal' economic outlook
- Bigger trouble, stimulus developing in China:
- China's economic growth set to slow to 30-year low this year; more government support seen: Reuters poll
- China steel mills cut back on high-grade iron ore as margins slump
- China vehicle sales fall 8.2% in 2019: industry association
- Auto industry cautious as China starts 2020 with forecast of a 2% sales decline
- China disposes of $289 billion of bad loans in 2019: regulator
- Wall Street hits record, boosted by trade and earnings optimism
- Tuesday, 14 January 2020
- Oil edges up after five days of losses ahead of U.S.-China trade pact
- Fed will continue repo offerings into February, reducing term operations
- Fed's George says keeping interest rates on hold 'appropriate' for now
- Signs of previous stimulus gaining traction in China:
- China December copper imports hit highest since March 2016; annual shipments fall
- China posts strong December exports as world awaits Sino-U.S. trade deal signing
- Wall Street dips from record in 'Jason Bourne market'
- Wednesday, 15 January 2020
- OPEC expects lower demand for its oil as U.S. hits new milestone
- With a mixture of fanfare and grievance, Trump signs U.S.-China trade deal
- What's in the U.S.-China Phase 1 trade deal
- 'Phase 2' U.S.-China trade talks have already begun: Pence
- Timeline: Key dates in the U.S.-China trade war
- Bigger trouble developing in the Eurozone: German growth slows sharply in 2019 as trade disputes bite
- Bigger stimulus developing in China: China will increase effective investment: Premier Li
- Fed's minions share opinions on policies, economic outlook:
- Fed's Harker says officials learned lessons from repo turmoil, still mulling standing facility
- Fed's Daly sees inflation reaching 2% goal next year
- Dow closes above 29,000 after China and U.S. sign trade truce
- Fed's Kaplan: Officials should be mindful of financial risk as they increase balance sheet
- Thursday, 16 January 2020
- Oil ends higher, as trade deal progress spurs energy demand hopes
- U.S. Senate approves U.S.-Mexico-Canada trade deal
- Bigger trouble, stimulus developing in China:
- China set to post weakest growth in 29 years as trade war bites, investment sputters
- China's new bank loans hit record in 2019, more stimulus expected
- Limits to bigger stimulus developing in China? Room is limited for further RRR cuts in China: central bank official
- Fed's Bowman: Current interest rate likely appropriate for "this year"
- S&P 500 blasts through 3,300 as tech stocks surge
- Friday, 17 January 2020
- Oil steadies as Chinese economy offsets trade optimism
- U.S. economy looking stronger than expected:
- U.S. housing starts at 13-year high, factory output gains
- U.S. manufacturing output rises unexpectedly
- Bigger stimulus developing in China:
- China will continue to cut taxes on a large scale: Premier Li
- China central bank curbs rates on structured deposits to coax banks to lower lending rates: sources
- Fed minions share opinions on yield curve, Fed policies:
- The yield curve's still weird. Fed's Bullard is okay with that
- Fed's Harker says economy looks 'pretty good,' inflation on track for 2% target
- Fed's Harker says central bank should be backstop for liquidity, not first stop
- Wall Street hits new highs in strongest week since August
But wait, there's more! Barry Ritholtz provides a bigger picture of what's going on in the world by listing the positives and negatives he found in the past week's economics and market-related news!
Welcome to the blogosphere's toolchest! Here, unlike other blogs dedicated to analyzing current events, we create easy-to-use, simple tools to do the math related to them so you can get in on the action too! If you would like to learn more about these tools, or if you would like to contribute ideas to develop for this blog, please e-mail us at:
ironman at politicalcalculations
Thanks in advance!
Closing values for previous trading day.
This site is primarily powered by:
CSS Validation
RSS Site Feed
JavaScript
The tools on this site are built using JavaScript. If you would like to learn more, one of the best free resources on the web is available at W3Schools.com.

