Since order has broken down for the S&P 500 (Index: SPX), the past week has proven to be challenging for projecting the future for the index.
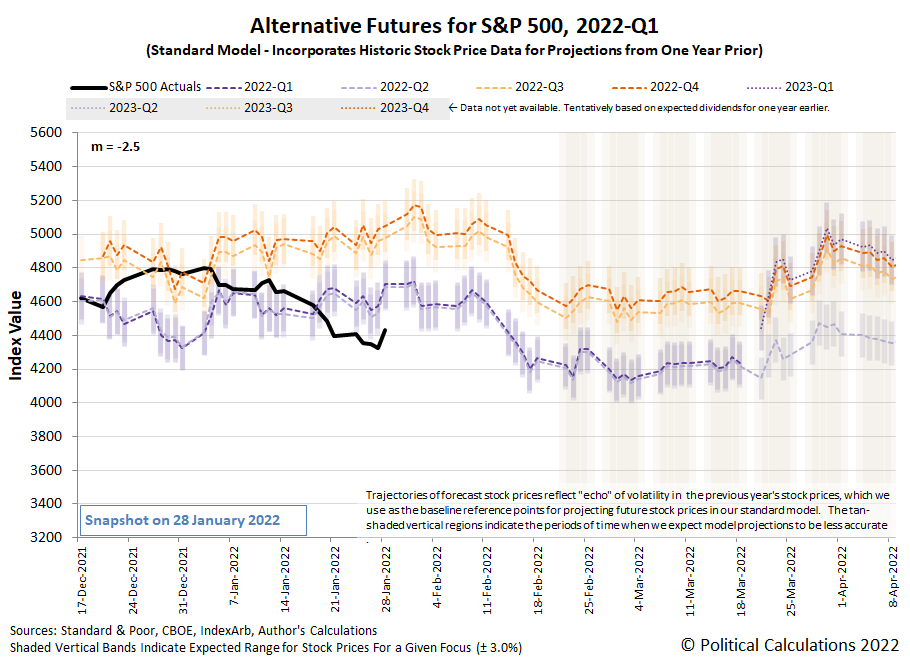
Here's an example of what we mean. The following chart illustrates the dividend futures-based model's alternative projections keeping all the same basic assumptions we've been using since 16 June 2021.
Going by this chart, the S&P 500's trajectory has fallen below the bottom end of the range we would expect if those assumptions still held.
But since this situation developed shortly before the Federal Reserve's Federal Open Market Committee's 25-26 January 2022 meetings, we have a unique opportunity to adjust the assumptions behind the model. That's because these meetings give us additional information we need to calibrate the model.
In this case, the additional information tells us exactly how far into the future investors are focusing their forward-looking attention. Thanks to the Fed's announced plan to accelerate the tapering of its purchases of treasuries that have been stimulating the U.S. economy and to start hiking short term interest rates, we confirm that investors are closely focused on the current quarter of 2022-Q1.
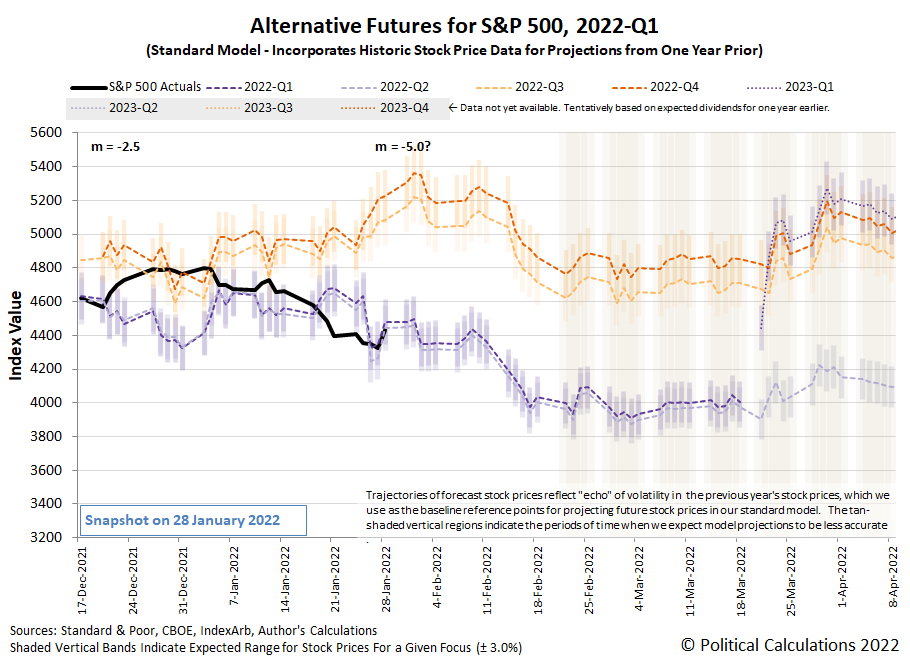
The announced change of monetary policies affects the dividend futures-based model by changing the value of m, the simple multiplier used in the model. The next chart shows the results we obtained when we matched the alternate future trajectory associated with investors focusing their attention on 2022-Q1 with the level of the S&P 500 on 26 January 2022 when the Fed officially announced its new monetary policy plans.
With a sample size of just three trading days since that event, it's still too early to tell if that will be a sufficient adjustment. The initial results are promising but we'll need many more days of trading to properly assess the model's performance.
In any case, our next calibration opportunity will come with the FOMC's next meeting six weeks from now. In between now and then, we'll have the random onset of new information to tell us how the model's multiplier might need to be adjusted. Here are the headlines that caught our attention for their market-moving potential, where we see the outsize role of the Fed in setting investor expectations and forward-looking focus during the past week.
- Monday, 24 January 2022
- Signs and portents for the U.S. economy:
- U.S. business activity slows in January amid Omicron wave -IHS Markit survey
- White House: Biden does not look at stock market to judge economy
- Anxiety over Fed tightening, Ukraine tensions sink stocks, oil
- U.S. puts 8,500 troops on alert to deploy amid Ukraine tensions
- Oil falls 2% as Fed rate hike talk spooks risk markets
- Fed minions being closely watched by market players:
- Fed tries to match economic risks against market's rush to tighten
- Fed could resort to outright asset sales to reduce balance sheet - Credit Suisse
- Bigger trouble developing in Eurozone:
- German economy likely shrunk in Q4: Bundesbank
- Euro zone recovery stumbled in Jan as Omicron hit services -PMI
- Bigger stimulus developing in China:
- ECB minions trying hard to set inflation expectations where they wan, but aren't sure about where inflation will go:
- ECB's Villeroy: ECB to do what is necessary to bring inflation around 2%
- ECB's Rehn expects euro zone inflation of around 2% in next two years -Handelsblatt
- Inflation outlook highly uncertain, ECB's Holzmann tells paper
- Wall Street closes higher in late market reversal
- Tuesday, 25 January 2022
- Signs and portents for the U.S. economy:
- Bigger trouble developing in Eurozone:
- German firms fear supply chain pain from China's battle with Omicron
- Analysis-After explosion in costs, central Europe's factories are passing on the pain
- Central banks clamping down on inflation:
- Wall Street ends lower, oil gains as investors await Fed
- Wednesday, 26 January 2022
- Signs and portents for the U.S. economy:
- U.S. new home sales surge to a nine-month high in December
- U.S. auto sales to slip in January on slim inventory, higher prices
- Oil breaks $90/bbl for the first time since 2014 on Russia tensions
- Fed minions to start rate hikes soon, will slow stimulus bond buys faster than expected:
- Fed flags rate hike 'soon,' plans for significant balance sheet reduction
- FOMC reaffirms March for taper end, and, maybe, rate hike
- Fed says bond maturity runoff will be main tool for shrinking balance sheet
- "Some People Are Prone to Suffer More": Powell Implodes Explaining Inflation
- Pre-FOMC Announcement Expectations
- Analysis-Fed tightening a sign to get the 'heck out' of U.S. stocks
- Explainer-How low can the Fed's balance sheet go? Here's what officials will be watching
- Analysis-Investors worry about hawkish Fed hurting growth, even theorize over next recession
- Analysis-Stock selloff is far from forcing the Fed to blink
- Bigger trouble developing in Eurozone:
- Central banks planning to hike rates:
- Wall Street gains evaporate, S&P 500 ends lower on Fed tightening timeline
- Thursday, 27 January 2022
- Signs and portents for the U.S. economy:
- U.S. pending home sales fall for second straight month in December
- Oil dips from seven-year high as Russia tensions offset Fed tightening
- U.S. economy likely regained steam in Q4, 2021 growth seen best in 37 years
- Fed minions want to stop stimulating economy, former minion says it's time investors take off their 'beer goggles":
- Fed signals intent to join the great central bank stimulus exit
- Fed's Fisher: Market Must Take Off "Beer Goggles" Because Powell's Not Coming To The Rescue
- Bigger stimulus developing in China:
- China's Dec industrial profits log small growth, strengthens case for PBOC support
- Analysis-Debt fears overshadow China's infrastructure push to fight economic slowdown
- Bank of Canada chickens out on hiking rates:
- The S&P ends lower after another roller-coaster session
- Friday, 28 January 2022
- Signs and portents for the U.S. economy:
- High inflation to stick this year, denting global growth: Reuters poll
- U.S. labor costs increase solidly in the fourth quarter
- Real U.S. yields in biggest monthly jump since 2013 taper tantrum
- Bank of America says it sees seven Fed rate hikes this year
- Just-in-time gives way to "buy everything you can" as U.S. supply disruptions persist
- Oil scales over 7-year peak on political risks, supply crunch
- Fed minions already concerned about rate hikes causing recession, Biden appointee flagged for intent to abuse power:
- Fed's matchmaker fear: Flatlining economy meets higher interest rates
- Fed guidance on rates following liftoff may remain foggy
- Fed needs to tighten 'a little bit:" Kashkari
- Weaker U.S consumer spending, rising inflation pose dilemma for Fed
- U.S. Chamber issues rare warning on Fed nominee Raskin, citing oil, gas views
- Mixed fortunes developing in Eurozone:
- COVID leaves Germany and France with contrasting economic fortunes
- Euro zone corporate lending growth continues to accelerate
- Spanish economic growth at fastest in 20 years but misses govt forecast
- Bigger stimulus developing in China:
- Bigger trouble developing in Mexico:
- Wall Street ends frenetic week with gains
As of the close of trading on 28 January 2022, the CME Group's FedWatch Tool projects quarter point rate hikes in March 2022 (2022-Q1), May 2022 (2022-Q2), June (2022-Q2), July (2022-Q3), and December (2022-Q4), making five rate hikes during 2022. The FedWatch tool also projects quarter point increases in March 2023 (2023-Q1) and July 2023 (2023-Q3).
Then again, the Atlanta Fed's GDPNow forecasting tool is projecting a near 0% real growth rate for GDP in the current quarter of 2022-Q1, which would bring the Fed's rate hiking plan and the expectations related to it into question.
Welcome to the blogosphere's toolchest! Here, unlike other blogs dedicated to analyzing current events, we create easy-to-use, simple tools to do the math related to them so you can get in on the action too! If you would like to learn more about these tools, or if you would like to contribute ideas to develop for this blog, please e-mail us at:
ironman at politicalcalculations
Thanks in advance!
Closing values for previous trading day.
This site is primarily powered by:
CSS Validation
RSS Site Feed
JavaScript
The tools on this site are built using JavaScript. If you would like to learn more, one of the best free resources on the web is available at W3Schools.com.

