When we say the bottom dropped out of the S&P 500 (Index: SPX) last week, what does that really mean?
It seems obvious that we're referring to the decline in stock prices, but there's much more to it than that. After all, the stock market has weeks when its value rises and has weeks when its value falls from the previous week, but we don't claim the bottom has dropped out of the index every time the latter situation happens. What makes the trading week ending 21 January 2022 different?
It wasn't the rate at which stock prices declined. On no single day of the holiday-shortened trading week did the S&P 500 drop by more than 2% of their previous day's closing value, the volatility threshold we use for any given day's trading to qualify as being interesting.
Nor did the overall 8.3% decline of the index since its 3 January 2022 record high qualify as interesting, falling less than the 10% threshold that it would take to qualify as a correction in stock prices according to professional traders. By both these definitions, what happened in the Nasdaq composite index (Index: COMP) during the past three weeks qualifies as interesting, but not so much for the more diverse S&P 500.
Instead, our observation has a lot to do with how stock prices were behaving in recent months. Here, let's start with the latest update to our chart showing the S&P 500's periods of relative order and chaos, which now covers the full 30-year period from December 1991 through December 2021.
According to a long-standing set of technical definitions we developed, here's how we define when a period of order exists in the market:
Order exists in a market whenever the change in the price of assets in the market are closely coupled with the change in the income that might be realized from owning or holding the assets, within a band of approximately normal variation about a central tendency.
In the case of the stock market, the assets are stocks, the price of which is given by the value of the S&P 500 index. The income that might be realized from owning or holding the assets are dividends, represented in the chart by the index' trailing year dividends per share.
When we refer to these two things being closely coupled, we mean when both the value of the S&P 500 and the index' trailing year dividends per share are either rising or falling together in a general trend. When that coupling exists, the variation of stock prices about a mean trend line can be approximately described by a normal distribution.
Looking at the most recent period of our 30-year chart, we see the period from March 2021 through December 2021 could reasonably qualify as a period of order according to our definition. Both stock prices and dividends per share have both been rising during these months.
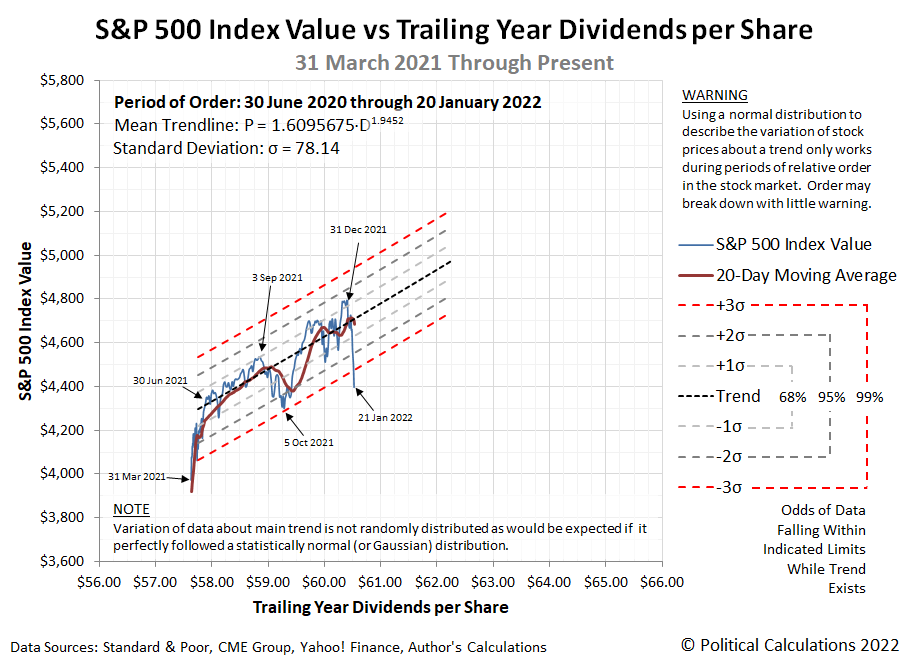
Our next chart zeroes in on this period with daily data, where we confirm a close coupling exists in the period from 30 June 2021 through the end of 2021 and into January 2022.
We've added statistical control chart-style thresholds to the chart to visualize a statistical hypothesis test. Here, when stock prices fall within three standard deviations of the mean trend, order can be said to exist for the S&P 500. Once stock prices fall outside that range indicated by the red dashed lines, we reject the hypothesis that order exists in the market.
On 21 January 2022, we see the level of stock prices drop below that key statistical threshold. We confirm order has broken down for the S&P 500 in this analytical approach and has done so by breaking through the lower limit of the range we would expect to find stock prices had the short established period of relative order in the U.S. stock market not broken down. This backward-looking approach confirms the similar assessment we arrived at using a forward-looking model.
To put it more colorfully, the bottom has dropped out of the S&P 500.
And now you know why we can say that! Now the question has become "is what happened on 21 January 2022 an outlier event and the trend still holds, or has it truly broken down?" We'll learn the answer to that question as early as this week.
Previously on Political Calculations
Labels: chaos, data visualization, dividends, SP 500, stock market, stock prices
Welcome to the blogosphere's toolchest! Here, unlike other blogs dedicated to analyzing current events, we create easy-to-use, simple tools to do the math related to them so you can get in on the action too! If you would like to learn more about these tools, or if you would like to contribute ideas to develop for this blog, please e-mail us at:
ironman at politicalcalculations
Thanks in advance!
Closing values for previous trading day.
This site is primarily powered by:
CSS Validation
RSS Site Feed
JavaScript
The tools on this site are built using JavaScript. If you would like to learn more, one of the best free resources on the web is available at W3Schools.com.

