It didn't take long for the S&P 500 (Index: SPX) to have a trading day qualify as "really interesting" by our standards, as Friday, 29 April 2022 delivered.
But what did it deliver after having already fallen off the proverbial edge? Simply put, investors have much more fully shifted their forward looking focus to 2022-Q2, thanks to increasing prospects the Fed will hike rates by three quarters of a point in June 2022. Here's how that growing realization looks on the dividend futures-based model alternative futures chart:
There's still room for the S&P 500 to fall lower, but without any erosion as yet in the expectations for future dividends, there's less immediate downside now than there was a week ago. The following market-moving headlines recap the random onset of new information that influenced the S&P 500's direction during the exciting and volatile week that was....
- Monday, 25 April 2022
- Signs and portents for the U.S. economy:
- Oil slumps 4% as Shanghai lockdowns stoke demand fears
- U.S. homebuilders to feel pricing pinch from rising mortgage rates, inflation
- Fed minions looking to get confirmed by Senate:
- Fed's Brainard confirmation set to move step closer, others wait in wings
- White House calls on Senate to vote on Fed nominees this week
- Bigger trouble developing in Eurozone:
- Morgan Stanley cuts euro zone GDP forecasts
- Exclusive-Germany to hike 2022 inflation forecast to 6.1% - document
- Bigger stimulus developing in China:
- Some Chinese state banks will cut deposit rates on Monday - sources
- China property firms joined c. bank talks on ways to help sector, sources say
- BOJ minions dig in on continuing stimulus policies:
- BOJ to keep ultra-low rates, dovish stance as inflation clouds recovery
- Japan readies $48 billion package to help with fuel and materials cost spikes
- ECB minions thinking about stopping stimulus policies:
- Nasdaq ends sharply higher after Twitter agrees to be bought by Musk
- Tuesday, 26 April 2022
- Signs and portents for the U.S. economy:
- U.S. new home sales dive in March; prices surge
- Oil rebounds on China's plans to support its economy
- Fed minions have a new Number 2:
- Bigger trouble developing in Asia:
- IMF warns of 'stagflationary' risks in Asia, cuts growth outlook
- S.Korea Q1 GDP growth slows, China risks cloud outlook
- Bigger stimulus developing in China:
- ECB minions trying to create impression they'll hike rates:
- BOJ minions told to keep stimulus going by new Japanese PM
- Wall Street ends sharply lower, Nasdaq tumbles
- Wednesday, 27 April 2022
- Signs and portents for the U.S. economy:
- U.S. pending home sales post 5th straight monthly decline in March
- Column-'Peak subscription' a red flag for U.S. economy and markets: McGeever
- U.S. goods trade deficit hits record high; Q1 GDP growth estimates slashed
- Oil prices edge up as worldwide supply concerns remain at the fore
- Bigger trouble developing in China, Russia, Eurozone:
- China Q1 consumption lags in key coastal provinces; Q2 off to weak start
- Russia's GDP decline could hit 12.4% this year, economy ministry document shows
- Europe decries 'blackmail' as Russia halts gas to Poland, Bulgaria
- Central bank minions plotting rate hikes:
- Australian inflation hits 20-yr high, May rate rise seen in play
- Norway's central bank to hold rates next week, raise in June- Reuters poll
- Wall Street ends higher supported by Microsoft
- Thursday, 28 April 2022
- Signs and portents for the U.S. economy:
- Oil prices rally on report that Germany drops opposition to Russian oil embargo
- U.S. economy shrinks in first quarter; trade, inventories mask underlying strength
- Uncertainty around what Fed minions will do:
- Bigger trouble developing in Asia:
- S.Korea April export growth to hit 14-mth low; inflation near 11-yr high: Reuters poll
- Analysis-China struggles for options as COVID threatens economic goals
- Bigger inflation developing in Eurozone:
- BOJ minions double down on stimulus:
- ECB minions ready to stand by to watch inflation expectations surge:
- Wall Street ends sharply higher, lifted by Meta and Apple
- Friday, 29 April 2022
- Signs and portents for the U.S. economy:
- Oil prices reverse late in session as heating oil contract plunges
- U.S. consumers shrug off high inflation, lean on savings to boost spending
- U.S. consumer sector braces for slowing demand as inflation bites
- Expectations Fed minions' bigger rate hikes taking hold:
- Bigger trouble developing in the Eurozone, China:
- Ukraine war curbs euro zone growth, inflation hits new high
- Broad-based euro zone inflation at record high 7.5% in April
- Negative-yielding corporate debt disappears as euro yields hit 8-year high
- German economy grew slightly in Q1, but Ukraine impact growing
- Spain's GDP growth slows to 0.3% in Q1 as Madrid readies cut to 2022 outlook
- French economy stalls in first quarter, inflation hits new record
- China's PMI likely to show steeper factory activity decline in April - Reuters poll
- Bigger stimulus developing in China:
- ECB minions trying to act all casual about hiking rates:
- Wall Street closes sharply lower on Amazon slump, inflation worries
The CME Group's FedWatch Tool projects the Fed will hike rates by a half point in May and June (2022-Q2) and again in July and September (2022-Q3). After that, the FedWatch tool anticipates quarter point rate hikes at six-week intervals through March 2023.
The BEA reported real GDP in 2022-Q1 fell by 1.4%, which was quite different from the Atlanta Fed's GDPNow tool's final forecast for a real gain of 1.3%. As expected, the GDPNow tool has shifted its focus toward 2022-Q2, where it anticipates a positive 1.9% real growth rate with respect to the level of 2022-Q1's real GDP level.
Update 4 May 2022
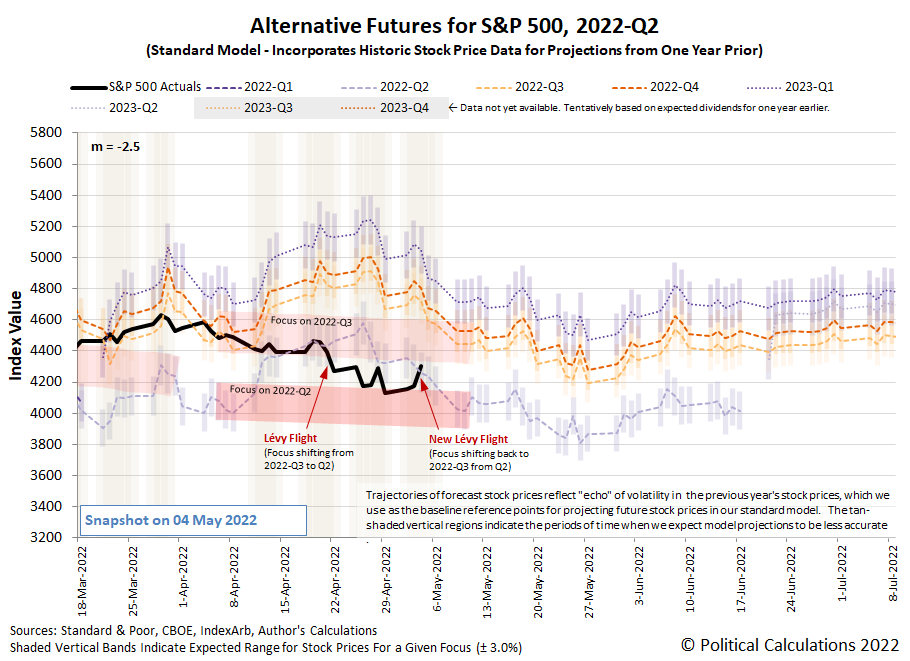
The day-over-day change in the S&P 500 definitely qualified as interesting today, after Fed Chair Jerome Powell took a 3/4% rate hike "off the table" for 2022-Q2 and possibly for 2022-Q3 as well. Investors immediately refocused their forward looking attention back toward 2022-Q3 in response. Here's how that change looks on the alternative futures chart whose purpose is to track these dynamics:
The Fed triggered the fourth Lévy flight of 2022 with investors shifting their future-oriented focus back toward 2022-Q3. With the Fed's expectation-setting actions now behind us and Q2 earnings season half over, we think it would take an exceptional development for investors to re-shift their focus back to the current quarter of 2022-Q2. Since such a shift would be accompanied by a large downward movement in the S&P 500, that now much lower probability represents a positive development in our book as we should now be on the opposite side of the volatility cluster.
So if such an apparently unlikely event happens, it won't be by accident. What could trigger such a reaction?
Update 5 May 2022
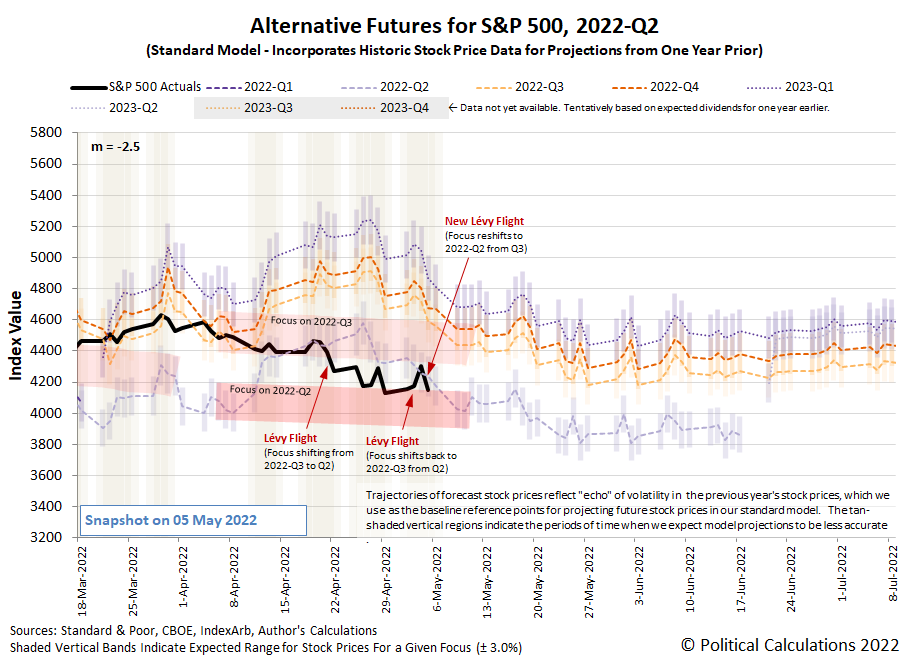
That last question was, in fact, a trick question. The thing that could trigger such a reaction is a sudden shift in the time horizon for investors, which on 5 May 2022, shifted strongly back toward 2022-Q2 from 2022-Q3. The reason: investors absorbed the new information of other nation's central banks implementing surprise rate hikes and called Jerome Powell's bluff that the Fed won't hike rates higher and faster to deal with the U.S.' higher relative rate of inflation. They've made new bets the Fed will be forced into a larger-than-half-point rate hike before the end of 2022-Q2. Here's what that looks like on the alternative futures chart:
Every time the forward-looking attention of investors strongly shifts from one point of time in the future to another, it qualifies as a new Lévy flight event by our definition. We're now up to five such events in 2022 and the only thing we'll guarantee at this point is that 2022 will experience at least one more Lévy flight event, which will happen sometime before the third Friday of June 2022. (When you read the previous sentence, put the emphasis on "at least one more"....)
This will be our last update to this post. We'll catch whatever happens on Friday, 6 May 2022 up with our next regular S&P 500 chaos series entry early on Monday, 9 May 2022. If you've been regularly following the series over the last several weeks, you're fully up-to-speed with the factors behind the U.S. stock market's recent volatility cluster.
Welcome to the blogosphere's toolchest! Here, unlike other blogs dedicated to analyzing current events, we create easy-to-use, simple tools to do the math related to them so you can get in on the action too! If you would like to learn more about these tools, or if you would like to contribute ideas to develop for this blog, please e-mail us at:
ironman at politicalcalculations
Thanks in advance!
Closing values for previous trading day.
This site is primarily powered by:
CSS Validation
RSS Site Feed
JavaScript
The tools on this site are built using JavaScript. If you would like to learn more, one of the best free resources on the web is available at W3Schools.com.


