Since the S&P 500 (Index: SPX) peaked at 4,796.56 on 3 January 2022, the index has dropped by 18.2% of that record high value. But that simple observation raises a question. What should the value of the S&P 500 be?
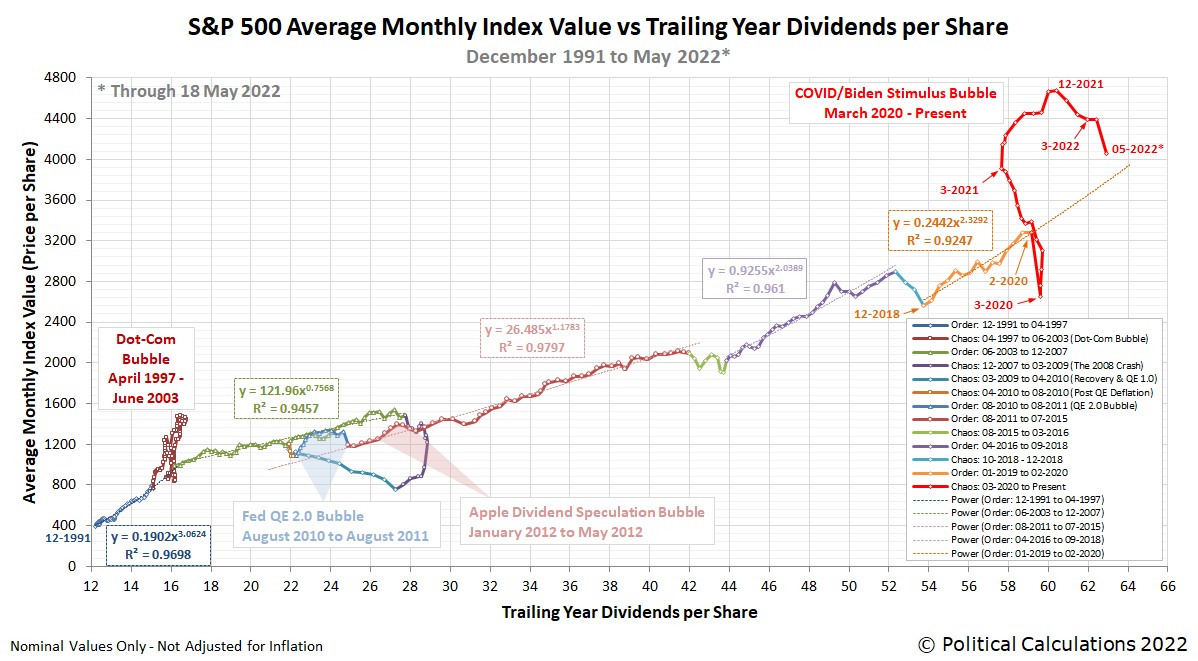
We have a couple of interesting ways to approach answering that question, the first of which relies upon how investors set the average level of the index with respect to its trailing year dividends per share during periods of relative order in the U.S. stock market. The following chart illustrates the five major periods of order the S&P 500 has experienced since December 1991, which have been periodically interrupted by periods of relative chaos.
In the chart, we show the mathematical relationships that have applied during those relative periods of order, which connects the average monthly value of stock prices (y) with the level of the index' trailing year dividends per share (x). We've built the following tool to do the related math to see how investors would set the value of the S&P 500 for the period of order you select for the trailing year dividends per share you enter. If you're accessing this article on a site that republishes our RSS news feed, you may need to click through to our site to access a working version of the tool.
Using the default selection of the most recent period of order, which lasted from December 2018 through February 2020, until the arrival of the coronavirus pandemic initiated a period of chaos for the U.S. stock market, we find that with May 2022's estimated $62.90 for trailing year dividends per share, the corresponding value of the S&P 500 would be $3,777.
Or rather, that's what the math suggests would be a reasonable level for the S&P 500 had that relative period of order continued to the present. Since that value is below the current level of the index, this result suggests stock prices still have room to fall, but it's important to note that this level is neither a ceiling nor a floor. It simply represents the mean to which stock prices would revert during this particular previous relative period of order.
That mean level is visualized as the extended trajectory for this relative period of order in the chart above, where you can see the chaotic impact the arrival of the coronavirus pandemic had in March 2020, followed by the bubble inflated by the COVID stimulus programs of 2020 and President Biden's inflation-generating American Rescue Plan Act stimulus program of March 2021. That bubble entered its deflation phase after December 2021, which is still underway today.
With more than one previous relative period of order to choose from, there's a lot of room for interpretation. Other selectable options, such as the one for the early 1990s, may suggest the S&P 500 is greatly undervalued for the dividends per share you enter. One of the cool things about this tool is you can do the math for any level of trailing year dividends per share you choose, so you can find out how stock prices could alternatively been set during the days of the Dot Com Bubble, if that's your area of interest, or during any of the other periods in between. Go ahead and take the tool for a test drive to explore the world of alternate S&P 500 valuations!
Can you project where the S&P 500 could go during periods of chaos?
We know what you're thinking. Wouldn't it be nice if you could project what a reasonable level for the S&P 500 would look like during periods of chaos for the stock market? It would indeed, and we have you covered there as well.
If you know what the expectations are for changes in the growth rate of dividends at different points of time in the future, and you know how far into the future investors are focusing their forward-looking attention as they set current day stock prices, you can reasonably project the level for the S&P 500 even during periods of chaos in the stock market. It has been possible since April 2009 and became practical to accomplish after November 2009, when the CBOE introduced modern quarterly dividend futures for the S&P 500.
Labels: chaos, data visualization, ideas, SP 500, tool
Welcome to the blogosphere's toolchest! Here, unlike other blogs dedicated to analyzing current events, we create easy-to-use, simple tools to do the math related to them so you can get in on the action too! If you would like to learn more about these tools, or if you would like to contribute ideas to develop for this blog, please e-mail us at:
ironman at politicalcalculations
Thanks in advance!
Closing values for previous trading day.
This site is primarily powered by:
CSS Validation
RSS Site Feed
JavaScript
The tools on this site are built using JavaScript. If you would like to learn more, one of the best free resources on the web is available at W3Schools.com.

