Political Calculations' initial estimate of median household income in August 2022 is $78,075, an decrease of $457 (or 0.58%) from the initial estimate of $78,532 in July 2022.
Update 31 October 2023: We have revised our estimate of median household income for this month based on new information from the U.S. Census Bureau for 2022 and revisions to income data by the Bureau of Economic Analysis that were released in September 2023. Please follow this link to see how much. If you're interested, we've provided more information about what has changed and why we think its significant.
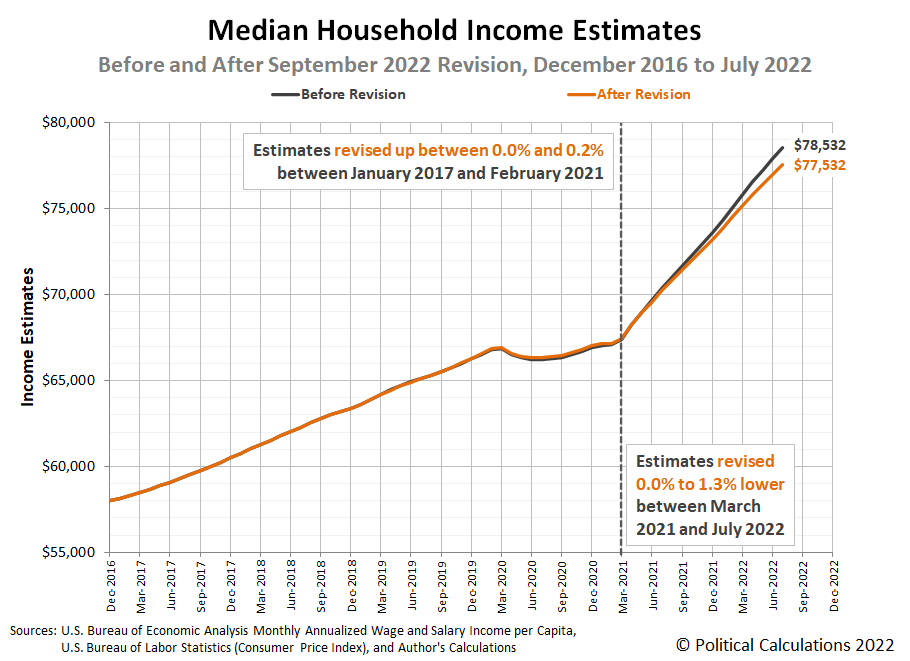
But that's only because the Bureau of Economic Analysis released its annual revision of its aggregate wage and salary data on 30 September 2022. The revision affects its data going back for several years, with July 2022's data undergoing the biggest change. The data revision reduced our estimate of median household income for July 2022 by $1,000 to $77,532. After that adjustment, we find that median household income in August 2022 rose by $543, or 0.7% from July's revised level.
We'll have more discussion about the revision in the analyst's notes. The latest update to Political Calculations' chart tracking Median Household Income in the 21st Century reflects the results of that revision, showing the nominal (red) and inflation-adjusted (blue) trends for median household income in the United States from January 2000 through August 2022. The inflation-adjusted figures are presented in terms of constant August 2022 U.S. dollars.
After the income data revision, we can confirm the first half of 2022 saw median household income decline in real terms, coinciding with a technical recession for the U.S. economy, in which inflation-adjusted GDP fell during this period as well. Median household income has rebounded in the months since, coinciding with low-to-negative month-to-month changes in the Consumer Price Index.
Analyst's Notes
In its latest data release, the BEA made significant adjustments to its aggregate wage and salary data from January 2017 through July 2022. The effect of the data revision can be divided into two periods. The first period runs from January 2017 through February 2021 and is characterized by very small revisions. Most notably, income data for 2020 was revised upward by as much as 0.2% in some months, though most adjustments were much smaller.
The period from March 2021 through July 2022 is much different. Here, the adjustments were all in one direction: down. The smallest was in March 2021, which rounds to 0.0%, but the revisions progressively grow larger each month until July 2022, which was revised down by 1.3%. This period directly coincides with the inflation unleashed by President Biden's spending programs.
The following chart illustrates the effect of all the data revisions on Political Calculations' estimates of median household income. The dark gray data series represents the estimates "before" the revision, the orange data series represents the "after" revision estimates:
The negative adjustment in median household estimates from March 2021 through July 2022 means that President Biden's inflation has been less affordable for the typical American household than previously indicated since it began.
For the latest in our coverage of median household income in the United States, follow this link!
References
U.S. Bureau of Economic Analysis. Table 2.6. Personal Income and Its Disposition, Monthly, Personal Income and Outlays, Not Seasonally Adjusted, Monthly, Middle of Month. Population. [Online Database (via Federal Reserve Economic Data)]. Last Updated: 30 September 2022. Accessed: 30 September 2022.
U.S. Bureau of Economic Analysis. Table 2.6. Personal Income and Its Disposition, Monthly, Personal Income and Outlays, Not Seasonally Adjusted, Monthly, Middle of Month. Compensation of Employees, Received: Wage and Salary Disbursements. [Online Database (via Federal Reserve Economic Data)]. Last Updated: 30 September 2022. Accessed: 30 September 2022.
U.S. Department of Labor Bureau of Labor Statistics. Consumer Price Index, All Urban Consumers - (CPI-U), U.S. City Average, All Items, 1982-84=100. [Online Database (via Federal Reserve Economic Data)]. Last Updated: 13 September 2022. Accessed: 13 September 2022.
Labels: median household income
Welcome to the blogosphere's toolchest! Here, unlike other blogs dedicated to analyzing current events, we create easy-to-use, simple tools to do the math related to them so you can get in on the action too! If you would like to learn more about these tools, or if you would like to contribute ideas to develop for this blog, please e-mail us at:
ironman at politicalcalculations
Thanks in advance!
Closing values for previous trading day.
This site is primarily powered by:
CSS Validation
RSS Site Feed
JavaScript
The tools on this site are built using JavaScript. If you would like to learn more, one of the best free resources on the web is available at W3Schools.com.

