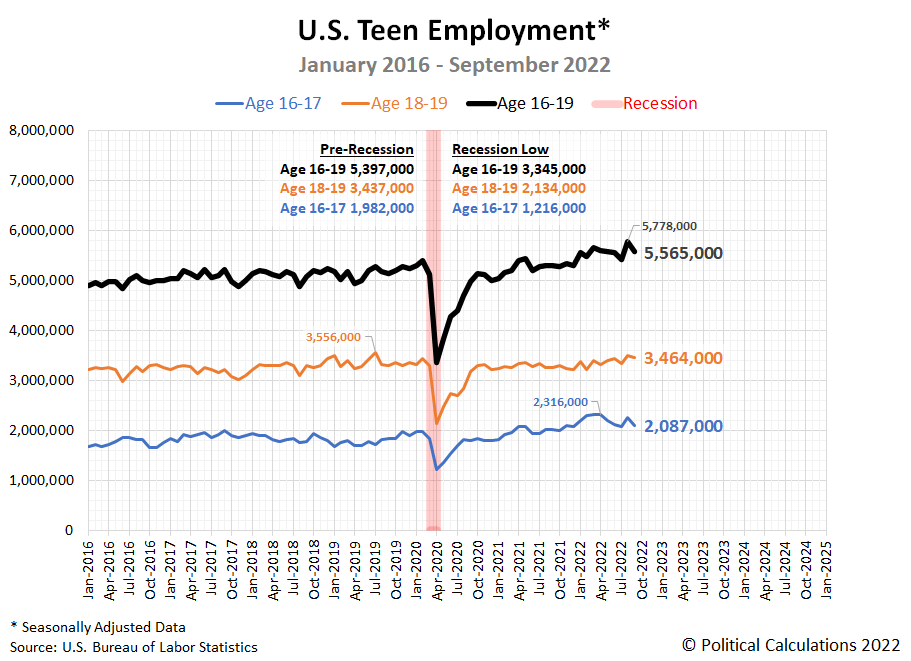
Last month's unexpected surge in the number of teens with jobs has largely dissipated. The U.S. Bureau of Labor Statistics reports the number of employed teens dropped by 213,000, falling to a seasonally-adjusted 5,565,000 in September 2022.
The following chart indicates most of that decline occurred among younger teens, while older teens saw a much smaller month-over-month reduction.
Readers should note that each data series in this chart has been put through its own seasonal adjustment by the BLS' analysts, which is why the figures for the Age 16-17 and Age 18-19 subgroups don't add up to the total for the Age 16-19 population. The non-seasonally-adjusted data does, which shows much larger month-over-month reductions for all groups than what's indicated in the chart. The factor that accounts for why the seasonal adjustment works that way is the annual start of the school year in September, which sees teens return to classrooms across the U.S.
Looking at the chart showing the employed-to-population percentages for each of these groups shows the effect of an interesting demographic quirk.
Here we find the seasonally-adjusted share of working Age 16-17 teens declined, as might be expected, but the percentage of Age 18-19 teens with jobs increased to the highest level shown in the data. Since the seasonally-adjusted data shows declines for both groups, the only way that can happen is if the estimated population of Age 18-19 year olds shrank during the month. Which, thanks to a quirk of statistical noise in the BLS' household survey data, is exactly what happened!
Finally, the topline seasonally-adjusted numbers for the September 2022 employment situation report indicate 158,936,000 Americans are employed, a month-over-month increase of 204,000 with the unemployment rate falling from 3.7% to 3.5% . The teen unemployment rate jumped from 10.4% to 11.4% in this period, consistent with how it has varied during the past year.
Reference
U.S. Bureau of Labor Statistics. Labor Force Statistics (Current Population Survey - CPS). [Online Database.] Accessed: 7 October 2022.
Labels: demographics, jobs
Welcome to the blogosphere's toolchest! Here, unlike other blogs dedicated to analyzing current events, we create easy-to-use, simple tools to do the math related to them so you can get in on the action too! If you would like to learn more about these tools, or if you would like to contribute ideas to develop for this blog, please e-mail us at:
ironman at politicalcalculations
Thanks in advance!
Closing values for previous trading day.
This site is primarily powered by:
CSS Validation
RSS Site Feed
JavaScript
The tools on this site are built using JavaScript. If you would like to learn more, one of the best free resources on the web is available at W3Schools.com.

