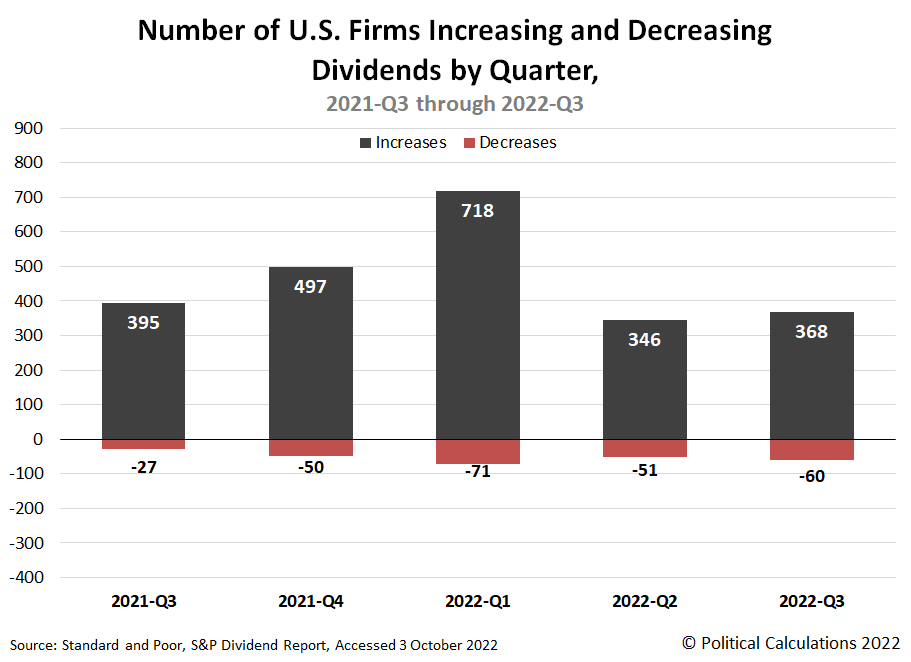
The third quarter of 2022 saw the U.S. stock market's dividend paying stocks turn in another mixed performance. The following chart visualizes the count of U.S. firms either increasing or decreasing their dividends from the year-ago quarter of 2021-Q3 through the just-completed 2022-Q3.
The bad news is that the number of dividend cuts has risen in 2022-Q3. Sixty firms reduced their dividend payments to shareholders. That figure is up from the previous quarter's total of 51 and is more than double the year ago quarter of 2021-Q3.
The good news is more mixed. While the number of U.S. companies boosting their dividends increased quarter-over-quarter from 346 to 368, the year-over-year data is down, falling from 2021-Q3's 395 dividend rises.
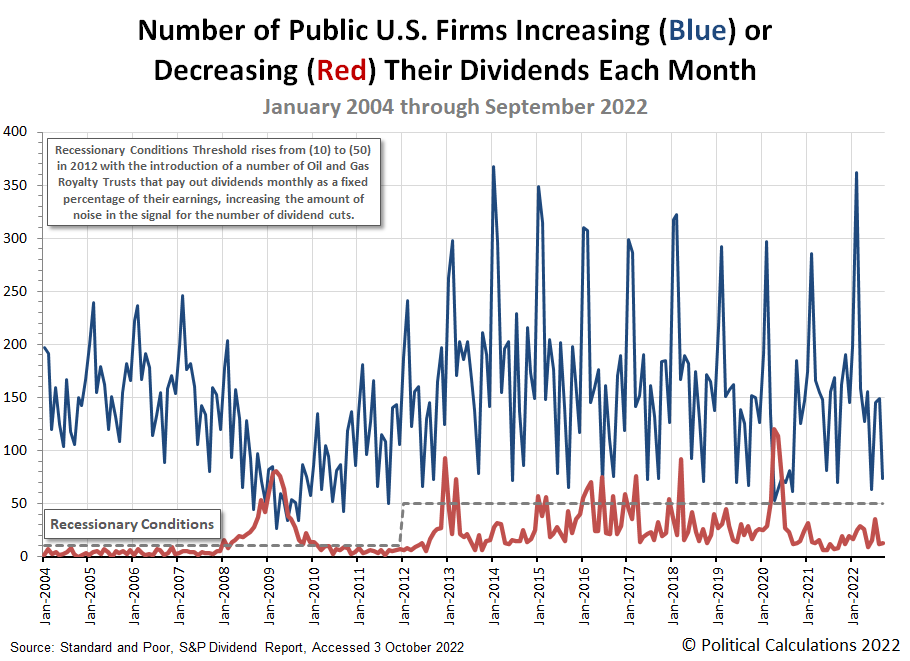
The next chart breaks down the number of dividend increases and decreases for each month from January 2004 through September 2022.
Here's how the U.S. stock market's dividend metadata has changed in September 2022 compared with August 2022's figures and with the year-ago totals recorded for September 2021:
- A total of 4,082 U.S. firms declared dividends in September 2022, an increase of 354 from August 2022's recorded value, but 1,123 fewer than did a year earlier in September 2021.
- 33 firms announced they would pay a special (or extra) dividend to their shareholders in September 2022, 41 less than August 2022 and 21 fewer than did in September 2021.
- A total of 74 firms declared they would increase their dividends in September 2022. That's 75 fewer than did in August 2022 but four more than September 2021's count.
- There were 13 dividend reductions announced during September 2022, an increase of one over August 2022's number of dividend cuts and five more than cut their dividends in September 2021.
- Once again, zero U.S. firms omitted paying their dividends, continuing the trend established since June 2021.
Here's our sampling of announced dividend cuts for September 2022. If you're a fan of REITs that are sensitive to interest rate hikes, it wasn't a good month. If you're someone who gets upset at seeing fixed and variable dividend-paying companies listed together as dividend cutters, it's time to clutch your pearls.
- Presidio Property Trust (REIT-Diversified) (NASDAQ: SQFT)
- The Marketing Alliance (OTC: MAAL)
- Hersha Hospitality (REIT-Hotel) (NYSE: HT)
- Mesa Royalty Trust (NYSE: MTR)
- San Juan Basin Royalty Trust (NYSE: SJT)
- Cross Timbers Royalty Trust (NYSE: CRT)
- Equity Commonwealth (REIT-Office) (NYSE: EQC)
- Chimera Investment (REIT-Mortgage) (NYSE: CIM)
- Steelcase (NYSE: SCS)
- Invesco Mortgage Capital (REIT-Mortgage) (NYSE: IVR)
- Ramaco Resources (NASDAQ: METC)
We counted three variable dividend-paying firms in this month's sampling, each from the oil and gas sector, which is well below the level that would indicate developing trouble for the industry. Then again, that's looking backward and not forward in time, so let's do that next.
On 4 October 2022, accounting giant KPMG announced the results of its 2022 U.S. CEO Outlook Survey. Marketplace's David Brancaccio interviewed KPMG's Paul Knopp about the results, here's the key takeaway:
David Brancaccio: I see from your data that nearly every CEO thinks there will be a recession. But what is this, maybe I’ll be grasping at straws here, but maybe it’ll be a little recession? What are the CEOs telling you about if this is mild or severe?
Paul Knopp: David, what this survey revealed is that 91% of CEOs think there will be a recession in the next 12 months. And only one-third of those CEOs believe that that recession will be mild and short. So while the survey didn’t have anything affirmative about how long a recession would last, or the severity of a recession, it certainly is true that they’re expecting a recession, that’s not going to be just mild and short.
That's 91% of 1,325 CEOs who KPMG surveyed between 12 July and 24 August 2022 who are anticipating a recession in the next 12 months. We anticipate the U.S. stock market's metadata for dividend cuts will provide a near real-time indication of the relative health of the U.S. economy over that period, much as it has in the past.
But then, that's why we track dividends by the numbers every month, with a special focus on dividend cutters. It's among the simplest near real-time economic indicators out there!
References
Standard and Poor. S&P Market Attributes Web File. [Excel Spreadsheet]. Accessed 3 October 2022.
Standard and Poor. S&P Indicated Rate Change. [Excel Spreadsheet]. Accessed 3 October 2022.
Labels: dividends, stock market
Welcome to the blogosphere's toolchest! Here, unlike other blogs dedicated to analyzing current events, we create easy-to-use, simple tools to do the math related to them so you can get in on the action too! If you would like to learn more about these tools, or if you would like to contribute ideas to develop for this blog, please e-mail us at:
ironman at politicalcalculations
Thanks in advance!
Closing values for previous trading day.
This site is primarily powered by:
CSS Validation
RSS Site Feed
JavaScript
The tools on this site are built using JavaScript. If you would like to learn more, one of the best free resources on the web is available at W3Schools.com.

