Consumer spending strongly rebounded in 2021 following the lifting of 2020's government-mandated pandemic lockdown measures.
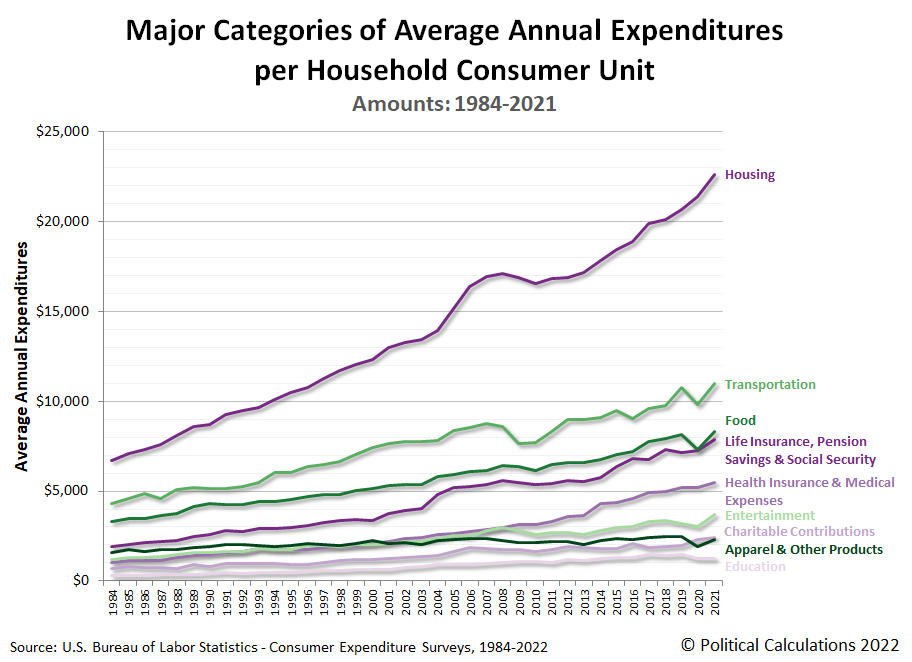
That's the biggest takeaway from the data presented in the 2021 Consumer Expenditure Survey, which saw the average American household consumer unit's expenditures increase by $5,594 over 2020's level to reach $66,928. That's a 9.1% year-over-year increase, the largest ever on record for the available data series that extends back to 1984. The first chart featured shows that full history from 1984 through 2021:
The Consumer Expenditure Survey breaks down the average annual expenditures of U.S. household consumer units into major categories of spending. The next chart shows the amount of spending from 1984 through 2021 for housing; transportation; life insurance, pension savings and Social Security; health expenditures and medical expenses; entertainment; charitable contributions; apparel and other products; and finally education, to rank them from largest to smallest.
With the exception of education, nearly all major categories of spending rose in 2021. Of these, transportation, food (especially in the subcategory of Food Away from Home), and Entertainment had the biggests year over year gains, which is consistent with the lifting of state and local government lockdown measures in 2021.
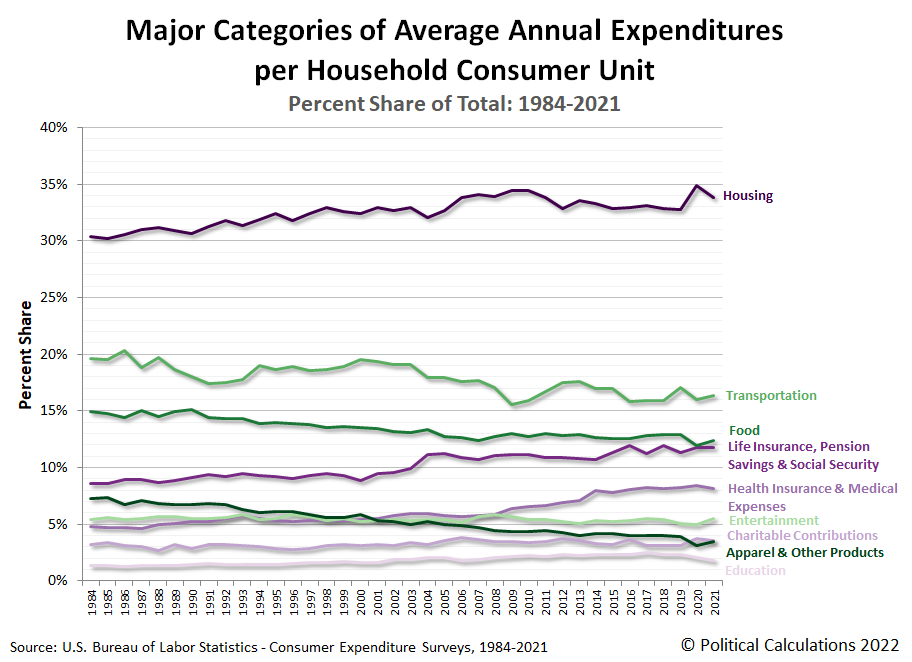
The third chart presents the share of each of the major categories of household spending as a percentage of average annual total expenditures.
As a percentage of total expenditures, the categories of housing, life insurance (including pension savings and Social Security), health insurance (and medical expenses), charitable contributions, and eductation each fell during 2021, while other spending categories increased.
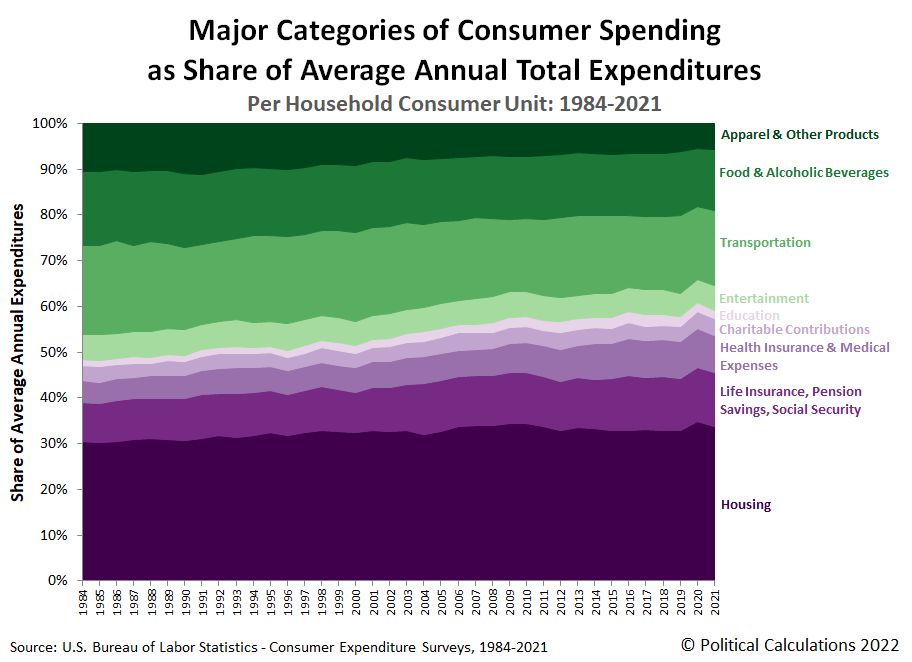
The final chart stacks all these major categories of household spending together to assemble the full picture of how the spending of American consumer unit households has changed each year from 1984 through 2021.
This last chart is our long-running favorite, in part because the colors convey which major categories of spending have generally risen over time (the purple-shaded components) or fallen over time (the green-shaded components).
Although we haven't addressed it, the Consumer Expenditure Survey's expenditure data also captures the early effects of President Biden's inflation. The survey also plays a key role in shaping how inflation itself will be measured because its data is used to set the relative weightings of the various expenditure categories within the Consumer Price Index.
References
U.S. Bureau of Labor Statistics. Consumer Expenditure Survey. Multiyear Tables. [PDF Documents: 1984-1991, 1992-1999, 2000-2005, 2006-2012, 2013-2020, 2021]. Accessed 8 September 2022.
Labels: data visualization, inflation, personal finance
Welcome to the blogosphere's toolchest! Here, unlike other blogs dedicated to analyzing current events, we create easy-to-use, simple tools to do the math related to them so you can get in on the action too! If you would like to learn more about these tools, or if you would like to contribute ideas to develop for this blog, please e-mail us at:
ironman at politicalcalculations
Thanks in advance!
Closing values for previous trading day.
This site is primarily powered by:
CSS Validation
RSS Site Feed
JavaScript
The tools on this site are built using JavaScript. If you would like to learn more, one of the best free resources on the web is available at W3Schools.com.


