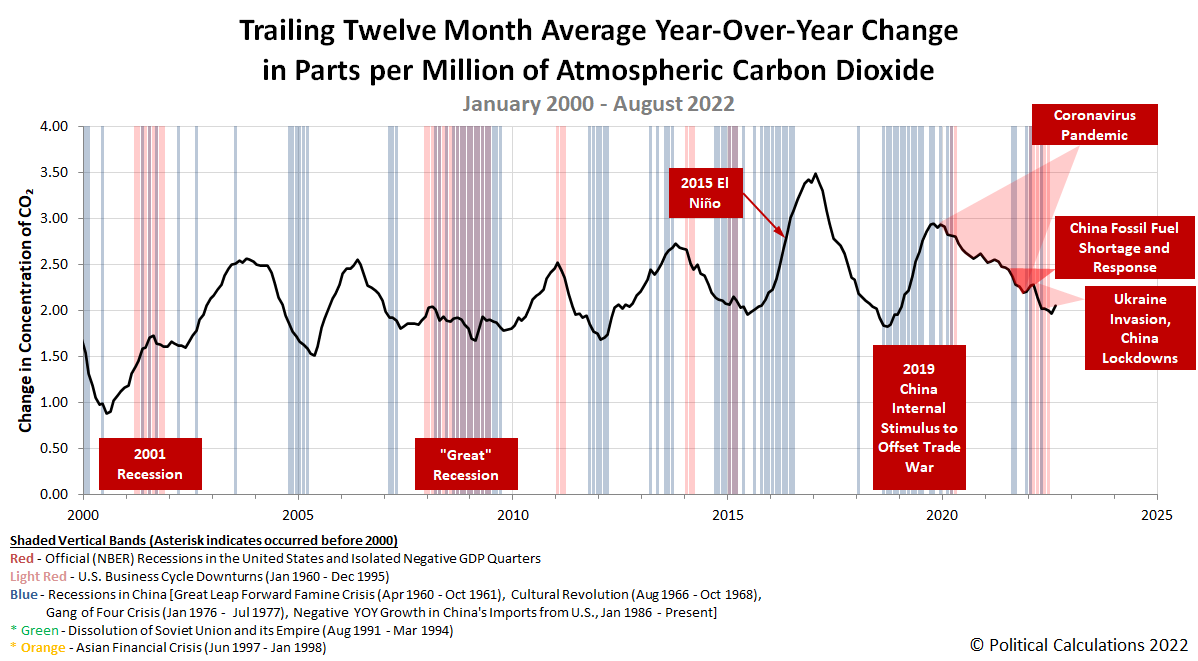
August 2022 saw a rebound in the rate at which carbon dioxide is being added to the Earth's atmosphere. That change directly follows July 2022's rebounds for the U.S. and China following months of sluggish economic activity in both countries during the first half of 2022.
That's the latest development for the global economy as measured by atmospheric carbon dioxide concentration data recorded at the remote Mauna Loa Observatory. The rebound can seen in the latest update to Political Calculations' chart revealing the rate at which CO₂ accumulates in the Earth's air.
China is, by far and away, the world's biggest producer of carbon dioxide emissions, a status it has undisputably held since 2006. In 2020, China's CO₂ emissions were nearly 2.3 times larger than those of the second-ranked United States, accounting for almost 31% of the world's carbon dioxide emissions. The two countries together accounted for 44.2% of the world's CO₂ emissions, which is directly linked to the output of their national economies.
That China's economy was struggling during the first half of 2022 was confirmed by the Helsinki-based Centre for Research on Energy and Clean Air, which measured a decline in China's CO₂ output:
China’s carbon emissions fell almost 8 per cent in the April-to-June quarter compared with the same period last year, the sharpest decline in the past decade, according to climate research service Carbon Brief.
The fall in emissions reflects a dramatic slowing in Chinese economic growth caused by large-scale coronavirus lockdowns and a crisis in the heavily indebted property sector. It was the fourth consecutive quarter in which emissions have fallen in China, the world’s biggest emitter.
Lauri Myllyvirta, an analyst at the Helsinki-based Centre for Research on Energy and Clean Air, which compiled the data for Carbon Brief, said there had been a drop of 44 per cent in the number of construction projects started and a 33 per cent fall in those completed during the second quarter.
Lauri Myllyvirta's analysis for China is available here, which indicates "emissions from power generation have rebounded in July and August". Given the several week lag for atmospheric carbon dioxide concentration data to reflect changes in economic activity, we anticipate the next month's data will continue showing upward movement in the pace at which carbon dioxide accumulates in the air.
References
National Oceanographic and Atmospheric Administration. Earth System Research Laboratory. Mauna Loa Observatory CO2 Data. [Text File]. Updated 5 September 2022. Accessed 5 September 2022.
Labels: economics, environment
Welcome to the blogosphere's toolchest! Here, unlike other blogs dedicated to analyzing current events, we create easy-to-use, simple tools to do the math related to them so you can get in on the action too! If you would like to learn more about these tools, or if you would like to contribute ideas to develop for this blog, please e-mail us at:
ironman at politicalcalculations
Thanks in advance!
Closing values for previous trading day.
This site is primarily powered by:
CSS Validation
RSS Site Feed
JavaScript
The tools on this site are built using JavaScript. If you would like to learn more, one of the best free resources on the web is available at W3Schools.com.
