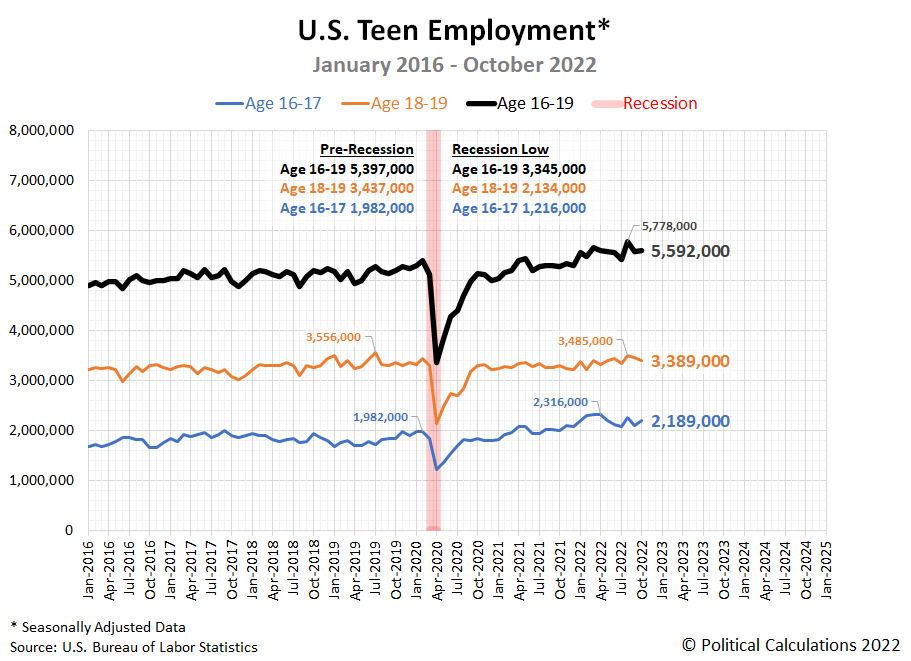
After falling last month, the number of American teens with jobs slightly increased in October 2022.
The U.S. Bureau of Labor Statistics reports the seasonally-adjusted number of employed teens rose by just 27,000 in October 2022, with 5,592,000 teens counted as having jobs during the month. The following chart shows that small net change, but also illustrates some bigger changes for the working teen population.
The chart shows 102,000 more 16 and 17 year-olds having jobs than did in September 2022, but 75,000 fewer 18 and 19 year-olds. [Note: Each data series in the chart has been processed through its own seasonal adjustment by the BLS' data jocks. Those adjustments are why the indicated count of working 16-17 year-olds and 18-19-year olds doesn't sum up to the total for Age 16-19 year olds. If you're a stickler for that detail, the raw data does. The BLS counted 2,193,000 working younger teens and 3,229,000 older teens within the Age 16-19 demographic, for a total of 5,422,000.]
The small month-over-month net changes in the number of working teens means there was also little change for the employed-to-teen-population. Here's the chart showing no meaningful change in existing trends.
Although it ticked upward by a small amount, October 2022's figures did nothing the alter the generally trajectory for teen employment of recent months.
Reference
U.S. Bureau of Labor Statistics. Labor Force Statistics (Current Population Survey - CPS). [Online Database.] Accessed: 4 November 2022.
Labels: demographics, jobs
Welcome to the blogosphere's toolchest! Here, unlike other blogs dedicated to analyzing current events, we create easy-to-use, simple tools to do the math related to them so you can get in on the action too! If you would like to learn more about these tools, or if you would like to contribute ideas to develop for this blog, please e-mail us at:
ironman at politicalcalculations
Thanks in advance!
Closing values for previous trading day.
This site is primarily powered by:
CSS Validation
RSS Site Feed
JavaScript
The tools on this site are built using JavaScript. If you would like to learn more, one of the best free resources on the web is available at W3Schools.com.

