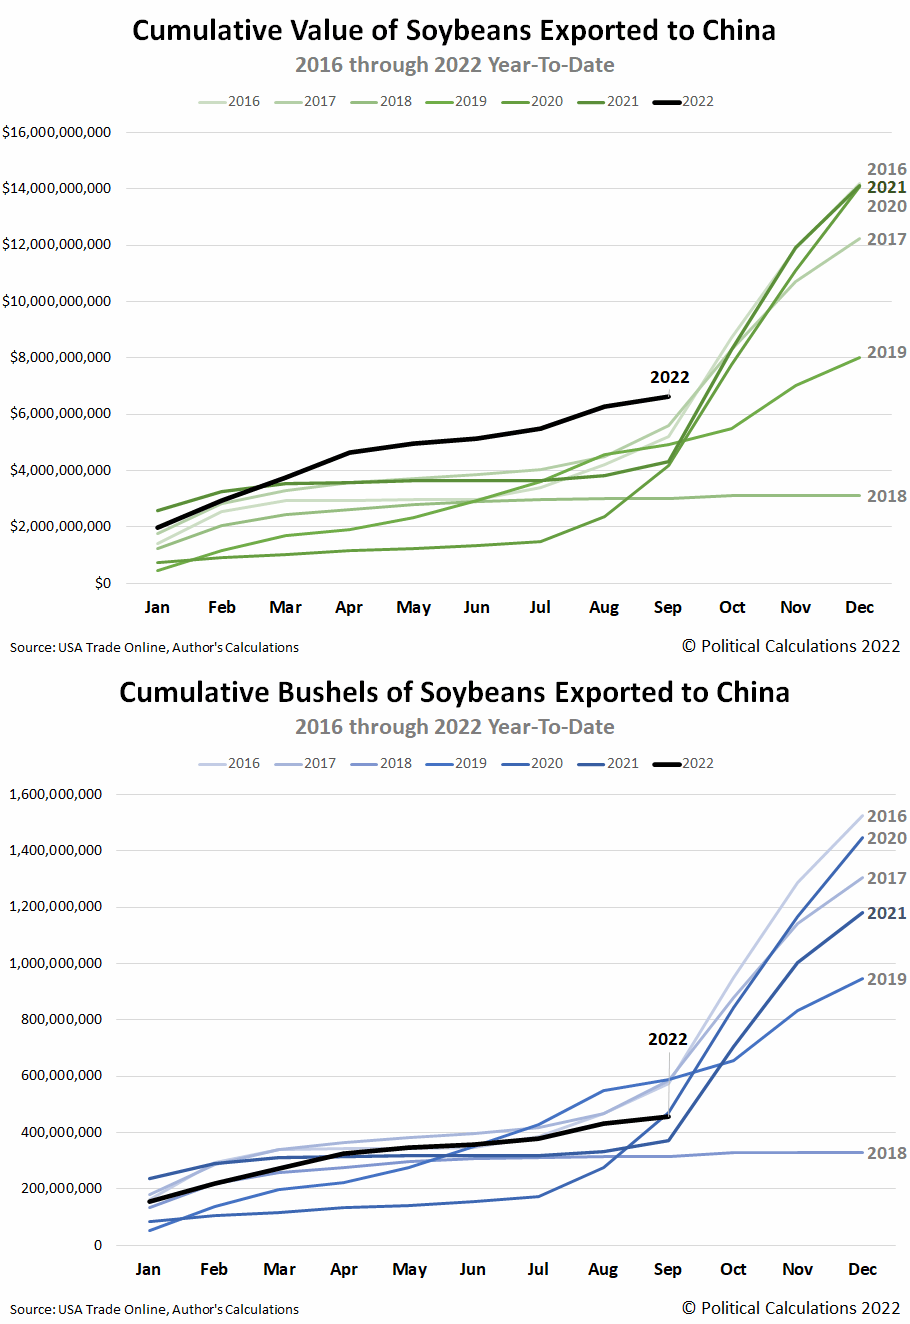
Every year, U.S. exports of soybeans peak during the months of October, November, and December. Since most of those exports head to China, we thought it might be interesting to take a snapshot of how 2022's crop is stacking up against previous years.
We pulled the available data on U.S. exports of soybeans to China from the U.S. Census Bureau's USA Trade Online database and calculated the month-by-month cumulative value of soybeans exported to China from January 2016 through the available year-to-date data for September 2022. We then estimated the quantity of soybeans exported each month by dividing these figures by the month's average soybean price per bushel. We generated two charts to illustrate the data and set them to cycle in the following animated chart, which takes us up to the beginning of the U.S.' peak soybean export season in 2022:
With the average price of soybeans mostly hovering within two dollars of $10 per bushel over this period, the cumulative value and quantity exported charts for most years are very similar to each other, including during the U.S-China trade war impacted years of 2018 and 2019. But two years really stand out as different from the others.
Let's start with the most obviously different. At first glance, the cumulative value of soybeans exported by the U.S. to China during 2022 leads all other years by a wide margin. But the animation quickly makes it very clear that the cumulative bushels of exported soybeans is very different, with 2022's quantity of exports far below 2016 and 2017's very high levels. That difference is directly attributable to the inflation of soybean prices, which began in 2021 and has continued in 2022.
2022's soybean price escalation is fairly easy to explain. Many of the soybean-growing regions in the U.S. experienced drought conditions, which both negatively affected crop yields and the ability of farmers to ship their crops to seaports by river. That drought comes as much of South America's soybean growing regions also experienced drought conditions during the year, with the resulting shortages boosting 2022's global soybean prices.
But it doesn't explain 2021's soybean price escalation, during which the seeds of today's soybean inflation were first sown. Here's the title of an article that identifies many of the additional factors that have contributed to that inflation.
Analysis: 'It's a madhouse': Organic U.S. soy prices hit record, fuel food inflation
Reading this October 2021 article, we find many of the underlying seeds behind today's soybean inflation were sown by several government interventions and failures that contributed to the shortages and price increases it describes for organic soybeans.
U.S. prices for organic soybeans used to feed livestock and manufacture soy milk have surged to record highs as imports that make up most of the country's supply have declined, triggering price increases for food including organically raised chicken.
The costly soybeans and higher-priced organic products are fueling food inflation at a time consumers are eager to eat better and focus on health during the COVID-19 pandemic. The $56 billion U.S. organic food sector is also grappling with a shortage of shipping containers and a tight labor market as global food prices hit a 10-year high....
U.S. imports of organic soybeans from September 2020 through August 2021 fell by 18% to about 240,585 tonnes, according to U.S. Department of Agriculture data. Shipments sank by 30% from Argentina, the biggest supplier to the United States.
Imports from India fell by 34%, extending a pre-existing decline after the United States in January toughened its requirements to certify Indian crops as organic.
There's a lot to unpack from this excerpt. First, we see the shortfall of organic soybean imports from India is directly attributable to the Biden administration's regulatory imposition of organic farming requirements as part of its anti-free trade measures aimed at protecting the special interests of a very small number of U.S. organic soybean farmers. Despite harming U.S. consumers, these anti-free trade measures have continued into 2022 with negative impact to both organic soybean prices and other downstream food products. Products like organic chicken, for example, that rely on consuming organic soybean feed to qualify as having been raised to meet arbitrary "organic" standards.
Meanwhile, the other factors the excerpt mentions also negatively impact the price of regular soybeans. The shortage of shipping containers is directly related to the Biden administration's leadership failures in addressing the logjam at the U.S.' west coast ports that it allowed to fester for months before taking its first actions to remedy it during October 2021. Finally, the shortfall of Argentina's soybeans can be traced to the Argentinian government's export policies, which have led many of its farmers to choose to stop growing soybeans in favor of corn, reducing the global supply.
None of these government interventions and failures would have stopped the drought conditions that inflated soybean prices throughout 2022. But that inflation would have been lower had they not contributed to starting the soybean inflation in the first place. In that regard, today's high inflation is very much a fiscal policy choice by politicians putting their special interests ahead of consumers.
Welcome to the blogosphere's toolchest! Here, unlike other blogs dedicated to analyzing current events, we create easy-to-use, simple tools to do the math related to them so you can get in on the action too! If you would like to learn more about these tools, or if you would like to contribute ideas to develop for this blog, please e-mail us at:
ironman at politicalcalculations
Thanks in advance!
Closing values for previous trading day.
This site is primarily powered by:
CSS Validation
RSS Site Feed
JavaScript
The tools on this site are built using JavaScript. If you would like to learn more, one of the best free resources on the web is available at W3Schools.com.
