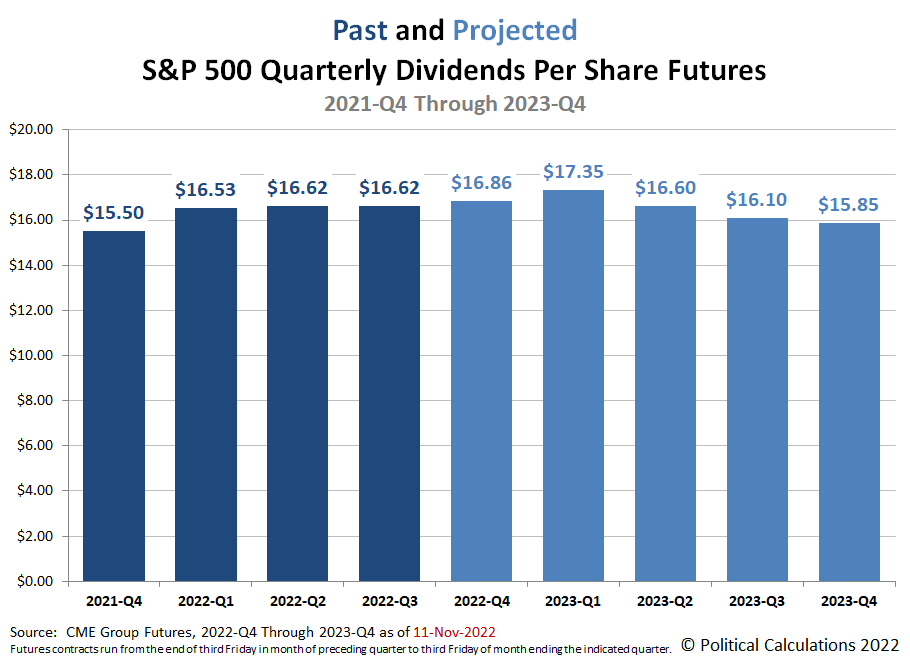
The outlook for future dividends per share of the S&P 500 (Index: SPX) improved since our summer snapshot. The following chart shows those expectations as of Friday, 11 November 2022:
Here's how investor expectations for the S&P 500's future quarterly dividends per share changed over the three months since that previous snapshot:
- 2022-Q3: Up $0.22 per share, final.
- 2022-Q4: Up $0.21 per share.
- 2023-Q1: Up $0.41 per share.
- 2023-Q2: Up $0.95 per share.
- 2023-Q3: Up $0.71 per share.
- 2023-Q4: New for this snapshot.
Analyst's Notes
Since the S&P 500 is also in the midst of an earnings recession, it may be surprising for some to learn that the outlook for future dividends has improved during that time.
There are two factors behind that outcome. First, the companies whose stocks make up the S&P 500 index are among the largest in the United States. Most of the dividend paying firms within the index set their dividends independently of their earnings, paying a fixed dividend each quarter. This factor is a major reason why stock prices are much less volatile than earnings.
The second and more relevant factor is that most of the reduced earnings have been among companies that don't pay dividends. Many technology sector firms fall into this category, where a representative example of a non-dividend paying firm whose earnings have plunged during 2022 from this sector is Meta Platforms (NASDAQ: META), the company formerly known as Facebook.
Dividend-paying stocks have outperformed the market by more than 20 percentage points in 2022. The businesses behind them may be less flashy than the tech sector, but they have had improving outlooks during the year. But with the Federal Reserve's interest rate hikes set to negatively impact a broad swath of the U.S. economy in 2023, the right question to ask is how long might that outperformance continue?
More About Dividend Futures
Dividend futures indicate the amount of dividends per share to be paid out over the period covered by each quarters dividend futures contracts, which start on the day after the preceding quarter's dividend futures contracts expire and end on the third Friday of the month ending the indicated quarter. So for example, as determined by dividend futures contracts, the "current" quarter of 2022-Q4 began on Saturday, 17 September 2022 and will end on Friday, 16 December 2022.
That makes these figures different from the quarterly dividends per share figures reported by Standard and Poor, who reports the amount of dividends per share paid out during regular calendar quarters after the end of each quarter. This term mismatch accounts for the differences in dividends reported by both sources, with the biggest differences between the two typically seen in the first and fourth quarters of each year.
Reference
The past and projected data shown in this chart was taken from the CME Group's S&P 500 quarterly dividend index futures on the indicated dates. The past data reflects the values reported by CME Group on the date the associated dividend futures contract expired, while the projected data reflects the values reported on 11 November 2022.
Labels: dividends, forecasting, SP 500
Welcome to the blogosphere's toolchest! Here, unlike other blogs dedicated to analyzing current events, we create easy-to-use, simple tools to do the math related to them so you can get in on the action too! If you would like to learn more about these tools, or if you would like to contribute ideas to develop for this blog, please e-mail us at:
ironman at politicalcalculations
Thanks in advance!
Closing values for previous trading day.
This site is primarily powered by:
CSS Validation
RSS Site Feed
JavaScript
The tools on this site are built using JavaScript. If you would like to learn more, one of the best free resources on the web is available at W3Schools.com.
