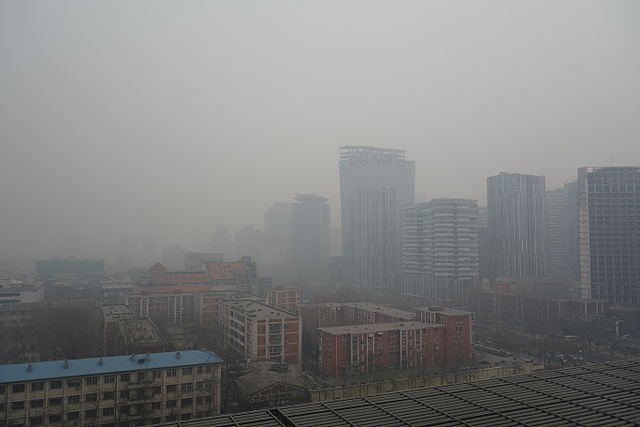
As expected, March 2023 saw an uptick in the pace at which carbon dioxide is accumulating in the Earth's atmosphere. While small, that change could mark the beginning of an improvement in global economic activity. Particularly in China, which ranks as the world's largest producer of carbon dioxide emissions by a very wide margin.
The country, which is on track to surpass the United States' total CO₂ historical emissions around 2050 has been struggling to gain economic traction since it lifted its zero-COVID lockdowns at the end of 2022. In March 2023, the country appears to have succeeded.
With greater economic output, the country's carbon dioxide emissions would have increased, which ultimately shows up in the Earth's atmosphere. The following chart shows that change as a small uptick that may mark the reversal of the downtrend of recent months should the planet's CO₂ accumulation rate continue increasing.
Much of China's role in becoming the planet's primary producer of carbon dioxide emissions has come as the result of its government's industrial policy. More remarkably, the Chinese government accelerated its production of coal-fired power plants during the past year, which may accelerate that achievement.
China permitted more coal power plants last year than any time in the last seven years, according to a new report released this week. It's the equivalent of about two new coal power plants per week. The report by energy data organizations Global Energy Monitor and the Centre for Research on Energy and Clean Air finds the country quadrupled the amount of new coal power approvals in 2022 compared to 2021.
That's despite the fact that much of the world is getting off coal, says Flora Champenois, coal research analyst at Global Energy Monitor and one of the co-authors of the report.
"Everybody else is moving away from coal and China seems to be stepping on the gas," she says. "We saw that China has six times as much plants starting construction as the rest of the world combined."
China's government is also expanding the country's output of coal and boosting its imports to fuel its growing count of coal-fired plants to power its factories as the country's economy recovers from its zero-COVID lockdowns.
References
National Oceanographic and Atmospheric Administration. Earth System Research Laboratory. Mauna Loa Observatory CO2 Data. [Text File]. Updated 5 April 2023.
Image source: WikiMedia Commons. Beijing Air Pollution by Kentaro IEMOTO@Tokyo (2014). Creative Commons Attribution-Share Alike 2.0 Generic license.
Labels: economics, environment
Welcome to the blogosphere's toolchest! Here, unlike other blogs dedicated to analyzing current events, we create easy-to-use, simple tools to do the math related to them so you can get in on the action too! If you would like to learn more about these tools, or if you would like to contribute ideas to develop for this blog, please e-mail us at:
ironman at politicalcalculations
Thanks in advance!
Closing values for previous trading day.
This site is primarily powered by:
CSS Validation
RSS Site Feed
JavaScript
The tools on this site are built using JavaScript. If you would like to learn more, one of the best free resources on the web is available at W3Schools.com.

