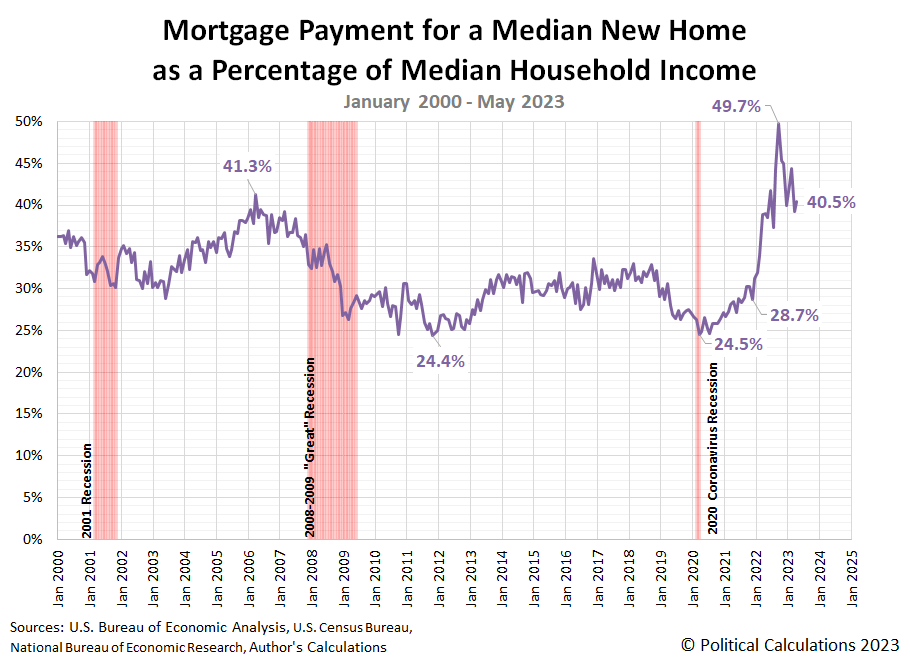
The relative affordability of the median new home sold in the U.S. was little changed in May 2023.
That's not entirely true. It worsened slightly because of a combination of factors.
Mortgage rates ticked up by less than a tenth of a percent to average 6.43% during the month, which combined with an increase in the median price of new homes sold to make them a little more costly for a household earning the median income in the U.S.
The net effect of these changes was to increase the amount that a fully-financed mortgage payment for the median new home sold in the U.S. costs. In May 2023, the initial estimate of that figure rose to 40.5% of the median American household's monthly income.
This estimate is well above the threshold of 36% of household income that marks the traditional limit of affordability for owning a home, assuming the homeowners have no other debt. This figure is also well above all-but-the-peak of relative unaffordability that prevailed during the housing bubble years of the early 2000s.
The following chart shows how May 2023's relative affordability fits among the data for the 21st century to date:
We're not the only ones pointing out how relatively unaffordable new homes have become.
Americans looking for a new home are facing the least affordable market ever, according to data from the Mortgage Bankers Association.
The group's Purchase Applications Payment Index (PAPI) increased 0.5% in April to a record high of 172.3. A higher reading indicates declining borrower affordability conditions, due to either increasing loan amounts, rising mortgage rates, or a decrease in earnings.
"This hit a new record because not only have interest not retreated from the high 6s, but the typical application amount has jumped, all faster than incomes have grown," Edward Seiler, MBA's associate vice president for housing economics, told Insider.
These days, what passes for improvement in the relative affordability of new homes has all taken place as new homes have remained even more unaffordable than they were when the housing bubble peaked!
References
U.S. Census Bureau. New Residential Sales Historical Data. Houses Sold. [Excel Spreadsheet]. Accessed 26 June 2023.
U.S. Census Bureau. New Residential Sales Historical Data. Median and Average Sale Price of Houses Sold. [Excel Spreadsheet]. Accessed 26 June 2023.
Freddie Mac. 30-Year Fixed Rate Mortgages Since 1971. [Online Database]. Accessed 26 June 2023. Note: Starting from December 2022, the estimated monthly mortgage rate is taken as the average of weekly 30-year conventional mortgage rates recorded during the month.
Image credit: House on Money by http://401kcalculator.org via Flickr. Creative Commons. Attribution-ShareAlike 2.0 Generic (CC BY-SA 2.0).
Labels: personal finance, real estate
Welcome to the blogosphere's toolchest! Here, unlike other blogs dedicated to analyzing current events, we create easy-to-use, simple tools to do the math related to them so you can get in on the action too! If you would like to learn more about these tools, or if you would like to contribute ideas to develop for this blog, please e-mail us at:
ironman at politicalcalculations
Thanks in advance!
Closing values for previous trading day.
This site is primarily powered by:
CSS Validation
RSS Site Feed
JavaScript
The tools on this site are built using JavaScript. If you would like to learn more, one of the best free resources on the web is available at W3Schools.com.

