The Affordable Care Act was signed into law in 2010. It was slowly implemented, going into full effect in 2014. One of the main goals of the law was to make health insurance more affordable for Americans, but has it worked?
One way to answer that question is to see how much Americans are paying for health insurance since the ACA became law and to compare that how much American households would otherwise have paid if the preceding trend for health insurance costs remained in place.
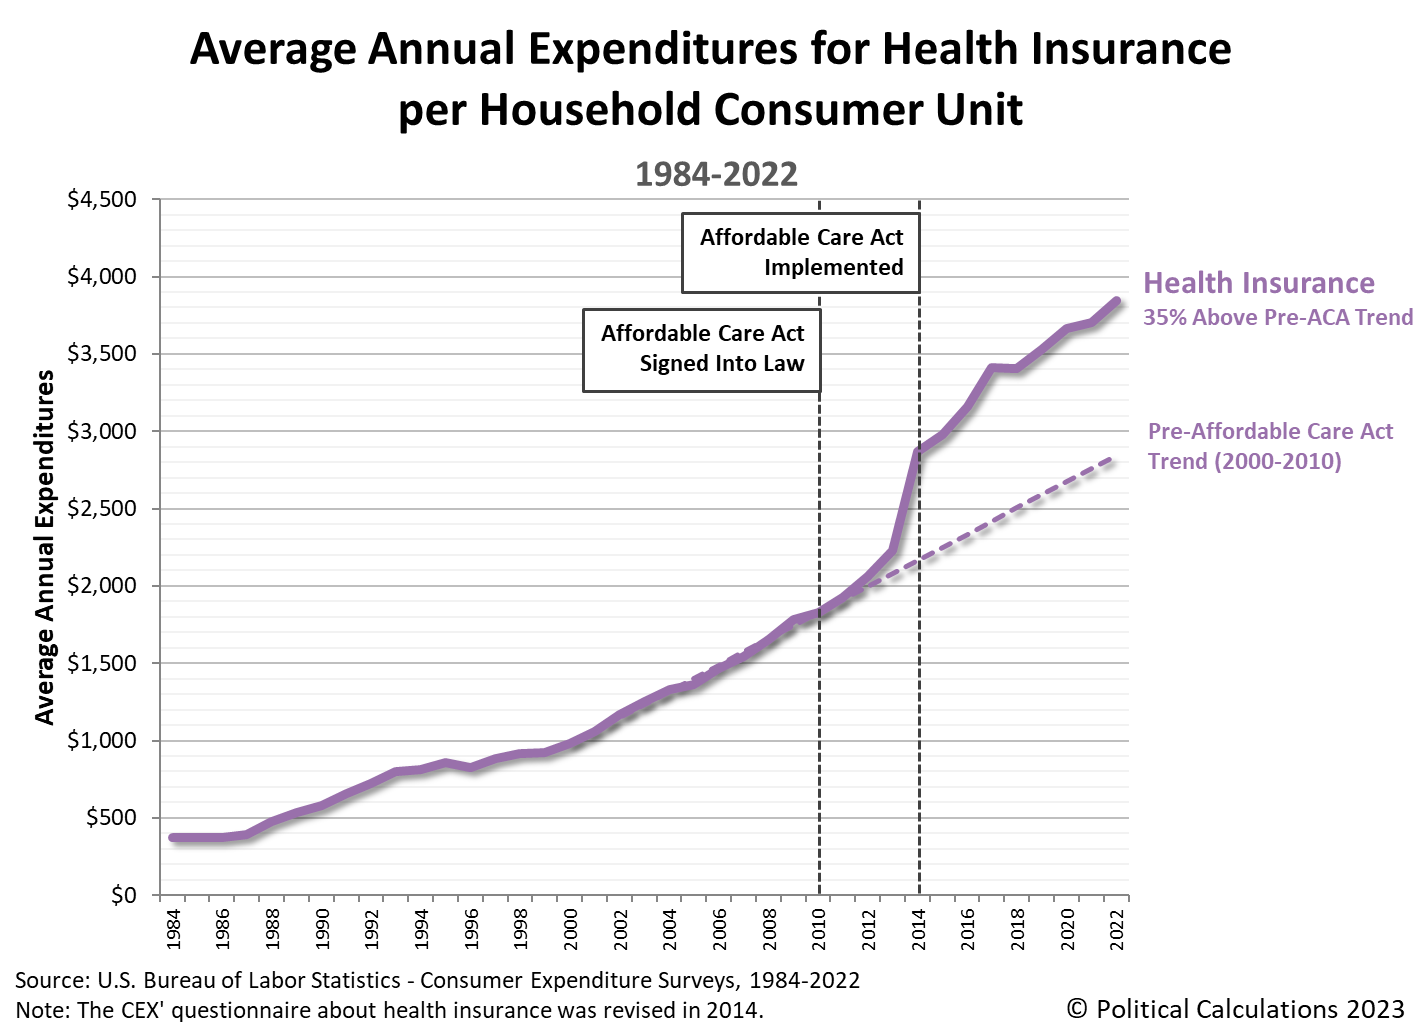
We can make comparison using data from the U.S. Census Bureau's annual Consumer Expenditure (CEX) Survey. The CEX has reported how much an average "consumer unit", which roughly corresponds to an American household, has paid for health insurance in each year from 1984 through 2022. It compares those data points with the trend based on the actual expenditures for health insurance from 2000 through 2010. Here's the chart:
Compared to the pre-Affordable Care Act trend from 2000 through 2010, Americans household consumers paid 35% more on average for health insurance in 2022 than they would otherwise have paid based on the trend for these costs from 2000 through 2010.
How does that compare with the household consumers' other major health care expenditures? The chart is adapted from an older version and narrows in on the period from 2008 through 2022 to track the change in the average expenditures per American consumer unit for several health care expenditure categories. These categories include health insurance, medical services, drugs, and medical supplies.
Through 2022, what American household consumers pay for drugs and medical supplies has changed very little, with medical supplies within $95 and drugs within $133 of their cost in 2008.
Expenditures for medical services has seen more growth over time. In 2013, the year before the Affordable Care Act took full effect, Americans paid just $69 more for medical services than they did in 2008. By 2019, that increased to $257, which then dipped to $137 in the pandemic year of 2020. What American consumer households pay for medical services has risen rapidly since, as of 2022 they reached $457 more than they paid in 2008.
But what Americans pay for health insurance has relentlessly risen in all but one year (2017). In 2013, just before the Affordable Care Act became fully operational, Americans paid $576 more for health insurance than they did in 2008. That jumped immediately to $1,215 in 2014, and has since risen to be $2,190 more than what American consumer units paid for health insurance in 2008.
2022 is the most recent year for which we have figures available. The Census Bureau will collect the data for 2023 in March 2024 and will crunch the numbers for several months before reporting it all sometime in September 2024.
References
Political Calculations. Visualizing Trends in American Consumer Spending. [Online article]. 26 September 2023.
U.S. Bureau of Labor Statistics. Consumer Expenditure Survey. Multiyear Tables. [PDF Documents: 1984-1991, 1992-1999, 2000-2005, 2006-2012, 2013-2020, 2021-2022]. Reference URL: https://www.bls.gov/cex/home.htm. 8 September 2023.
Image credit: Photo of Patient Protection and Affordable Care Act with stethoscope by Marco Verch under Creative Commons 2.0.
Labels: data visualization, health insurance, personal finance
Welcome to the blogosphere's toolchest! Here, unlike other blogs dedicated to analyzing current events, we create easy-to-use, simple tools to do the math related to them so you can get in on the action too! If you would like to learn more about these tools, or if you would like to contribute ideas to develop for this blog, please e-mail us at:
ironman at politicalcalculations
Thanks in advance!
Closing values for previous trading day.
This site is primarily powered by:
CSS Validation
RSS Site Feed
JavaScript
The tools on this site are built using JavaScript. If you would like to learn more, one of the best free resources on the web is available at W3Schools.com.


