
How much is the typical American household consumer unit paying out of pocket for health insurance premiums? And how has that changed from 1984 through 2024?
The annual Consumer Expenditure Survey is the go-to source for this kind of information, detailing how American consumer units spend money. "Consumer units", if you weren't already aware of this peculiar expression, is the Bureau of Labor Statistics' data jocks' affectionate nickname for American households that are close to, but not quite equivalent to, households. For what it's worth, the most basic difference is that a "consumer unit" in 2024 consisted of 2.4 people, but a household consisted of 2.54 people. Because that difference is very small, we'll just call it a "household consumer unit" and run with it.
In 2024, the average U.S. household consumer unit spent an average of $78,535 on everything it bought during the year. On average, that household consumer unit spent $4,055, or a little under 5.2% of its total expenditures, out of its own pocket for health insurance in 2024.
Our first chart tracks how the overall trend for out-of-pocket expenditures on health insurance has changed from 1984 through 2024:

The amount that Americans pay on health insurance has not slowed down since the implementation of the Affordable Care Act (ACA) of 2010. The law, which was intended to "bend the cost curve" of health insurance downward, has failed.
Our second chart looks at the more recent history from 2008 through 2024, where here, we're tracking the change in how health care costs have changed since 2008.

We find the cost of health insurance has been increasing much faster than the costs for what Americans pay out-of-pocket for medical services, drugs, and medical supplies. All these costs have risen since the Biden administration unleashed high inflation in 2021, but health insurance has increased the most out of all these categories.
References
U.S. Bureau of Labor Statistics. Consumer Expenditure Survey. Multiyear Tables. [PDF Documents: 1984-1991, 1992-1999, 2000-2005, 2006-2012, 2013-2020. Excel spreadsheet: 2021-2024]. Reference URL: https://www.bls.gov/cex/home.htm. 19 December 2025.
Image credit: Health Insurance Card and Stethoscope photo by Marek Studzinski on Unsplash.
Labels: health insurance, personal finance


The Consumer Expenditure Survey (CEX) now covers forty years worth of data for how Americans households spend money.
That data includes how much the average "consumer unit" surveyed by the U.S. Census Bureau spends on health insurance, which like many other things in the economy, has seen significant cost inflation over the past four decades.
The following chart shows how that cost has changed from 1984, the first year for the CEX, through 2023, the latest, whose data was just released last month. As you'll see, over the past 40 years, there has been one major factor that has altered the trajectory for how much American households/consumer units pay on average for health insurance coverage.

Back in 1984, the first year for the CEX, American household consumer units paid an average of $370 for health insurance. That figure grew steadily over the following years and by 2000, the average cost of health insurance for a U.S. household has risen to $980.
From 2000 through 2010, the average cost of health insurance grew faster, reaching $1,826 by 2010. Had the 2000 through 2010 growth trend continued, we estimate the average amount American households would pay for health insurance in 2023 would be $2,927.
But it didn't, thanks to the passage of the Affordable Care Act, which was signed into law in 2010. It was implemented over several years, going into full effect in 2014. The claimed goal of the law, as suggested by its name, was to make health insurance more affordable for Americans.
In 2023, the average cost of health insurance paid by American households has more than doubled what it was in 2010. At an average $4,049 per household, this expense is more than 38% higher than the trend that existed in the decade before the Affordable Care Act became law.
The chart also indicates the cost "curve" for health insurance has bent upward since 2021, which has inflated more quickly over the last few years following 2020's coronavirus pandemic.
We'll be featuring other aspects of how American consumer spending has changed over the past four decades using the latest CEX data in the weeks ahead.
References
U.S. Bureau of Labor Statistics. Consumer Expenditure Survey. Multiyear Tables. [PDF Documents: 1984-1991, 1992-1999, 2000-2005, 2006-2012, 2013-2020. Excel spreadhseets: 2021-2023].
Image credit: Health Insurance Claims by U.S. National Institutes of Health Medical Arts and Photography Branch via Flickr. Public domain image.
Labels: health insurance, inflation

The Affordable Care Act was signed into law in 2010. It was slowly implemented, going into full effect in 2014. One of the main goals of the law was to make health insurance more affordable for Americans, but has it worked?
One way to answer that question is to see how much Americans are paying for health insurance since the ACA became law and to compare that how much American households would otherwise have paid if the preceding trend for health insurance costs remained in place.
We can make comparison using data from the U.S. Census Bureau's annual Consumer Expenditure (CEX) Survey. The CEX has reported how much an average "consumer unit", which roughly corresponds to an American household, has paid for health insurance in each year from 1984 through 2022. It compares those data points with the trend based on the actual expenditures for health insurance from 2000 through 2010. Here's the chart:
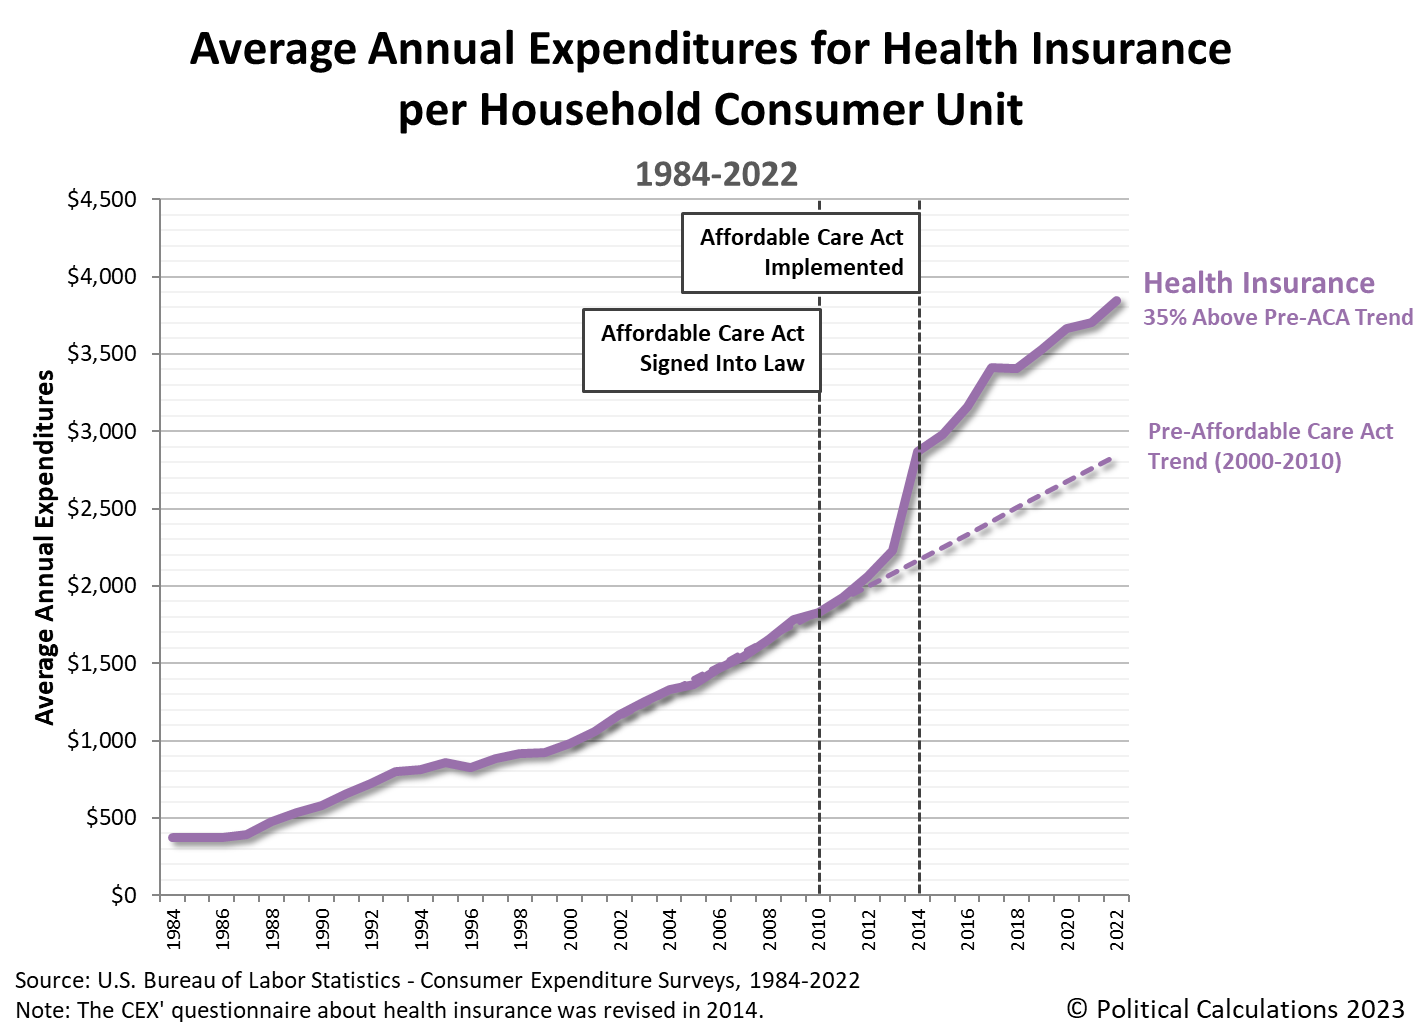
Compared to the pre-Affordable Care Act trend from 2000 through 2010, Americans household consumers paid 35% more on average for health insurance in 2022 than they would otherwise have paid based on the trend for these costs from 2000 through 2010.
How does that compare with the household consumers' other major health care expenditures? The chart is adapted from an older version and narrows in on the period from 2008 through 2022 to track the change in the average expenditures per American consumer unit for several health care expenditure categories. These categories include health insurance, medical services, drugs, and medical supplies.

Through 2022, what American household consumers pay for drugs and medical supplies has changed very little, with medical supplies within $95 and drugs within $133 of their cost in 2008.
Expenditures for medical services has seen more growth over time. In 2013, the year before the Affordable Care Act took full effect, Americans paid just $69 more for medical services than they did in 2008. By 2019, that increased to $257, which then dipped to $137 in the pandemic year of 2020. What American consumer households pay for medical services has risen rapidly since, as of 2022 they reached $457 more than they paid in 2008.
But what Americans pay for health insurance has relentlessly risen in all but one year (2017). In 2013, just before the Affordable Care Act became fully operational, Americans paid $576 more for health insurance than they did in 2008. That jumped immediately to $1,215 in 2014, and has since risen to be $2,190 more than what American consumer units paid for health insurance in 2008.
2022 is the most recent year for which we have figures available. The Census Bureau will collect the data for 2023 in March 2024 and will crunch the numbers for several months before reporting it all sometime in September 2024.
References
Political Calculations. Visualizing Trends in American Consumer Spending. [Online article]. 26 September 2023.
U.S. Bureau of Labor Statistics. Consumer Expenditure Survey. Multiyear Tables. [PDF Documents: 1984-1991, 1992-1999, 2000-2005, 2006-2012, 2013-2020, 2021-2022]. Reference URL: https://www.bls.gov/cex/home.htm. 8 September 2023.
Image credit: Photo of Patient Protection and Affordable Care Act with stethoscope by Marco Verch under Creative Commons 2.0.
Labels: data visualization, health insurance, personal finance
Americans collectively spent over $447.5 billion of their own money to cover the cost of unsubsidized health insurance in 2018, an increase of 0.8% from the more than $443.8 billion spent in 2017. At an average annual cost of $3,405 per household consumer unit however, 2018's spending represents the first year over year decline in this category of consumer expenditures since 1996, falling from 2017's average cost per household consumer unit of $3,414.

This data comes from Consumer Expenditure Survey (CEX), which shows the continuing effect of the skyrocketing cost of health insurance caused by the passage and implementation of the Affordable Care Act during the Obama administration. In this case, the rapid escalation of health insurance costs to higher income earning households that could previously afford coverage may be prompting them to choose to become uninsured, which would contribute to the indicated reduction in average cost.
From 2017 to 2018, the number of individual uninsured Americans rose by 1.9 million, from 25.6 million to 27.5 million, which the U.S. Census Bureau reveals a very large portion of this increase was uniquely concentrated in households earning well above the median household income of $61,392 for 2018:
Between 2017 and 2018, overall health insurance coverage decreased 1.0 percentage point for people in families with income from 300 to 399 percent of poverty and 0.8 percentage points for people in families with income at or above 400 percent of poverty. During this time, the overall health insurance coverage rate did not statistically change for any other income-to-poverty group.
Here's how that translates into the number of affected individuals:
The number of uninsured Americans in households with income above 400 percent of the poverty line increased by 1.1 million from 2017 to 2018, and the number of uninsured in households with income above 300 percent of the poverty line — about $75,000 for a family of four — increased by 1.6 million.
Households in this category, which includes many headed by small business owners and self-employed income earners who don't have access to other employer-provided health insurance coverage, are largely choosing to go from paying top dollar or near-top dollar for health insurance to no such coverage, even though they would still be subject to additional income taxes from the Affordable Care Act's mandate penalty. For these higher income earning households, since the rising cost of coverage they must pay has been driven up by the requirements of the Affordable Care Act to the point where it far exceeds the value of tax subsidies available to them, dropping the amount they pay for family coverage from nearly $20,000 to $0 per household is having a noticeable effect on the overall average cost paid out of pocket by all American households for health insurance, which is being captured by the CEX data for 2018.
The Trump administration has introduced reforms aimed at arresting the skyrocketing cost of health insurance for these households in late 2018 to address their specific needs, which may not show an effect until the 2019 data becomes available.
Data Sources
U.S. Bureau of Labor Statistics and U.S. Census Bureau. Consumer Expenditure Survey. Multiyear Tables. [PDF Documents: 1984-1991, 1992-1999, 2000-2005, 2006-2012, 2013-2018]. Reference Directory: https://www.bls.gov/cex/csxmulti.htm. 10 September 2019.
U.S. Census Bureau. Health Insurance Coverage in the United States: 2018. [PDF Document]. 10 September 2019.
Labels: demographics, health insurance, personal finance

If your health insurer offered you cash to choose a less expensive provider for medical treatment, would you take it?
That's a question whose answer has the potential to reduce the cost of health care, which was investigated by Christopher Whaley, Lan Vu, Neeraj Sood, Michael Chernew, Leanne Metcalfe and Ateev Mehrotra, whose findings were recently published in Health Affairs. Here's the abstract of their paper:
Employers and insurers are experimenting with benefit strategies that encourage patients to switch to lower-price providers. One increasingly popular strategy is to financially reward patients who receive care from such providers. We evaluated the impact of a rewards program implemented in 2017 by twenty-nine employers with 269,875 eligible employees and dependents. For 131 elective services, patients who received care from a designated lower-price provider received a check ranging from $25 to $500, depending on the provider’s price and service. In the first twelve months of the program we found a 2.1 percent reduction in prices paid for services targeted by the rewards program. The reductions in price resulted in savings of $2.3 million, or roughly $8 per person, per year. These effects were primarily seen in magnetic resonance imaging and ultrasounds, with no observed price reduction among surgical procedures.
The American Council on Science and Health's Chuck Dinerstein was less than impressed by this outcome, where he notes that insurance policies that aim to motivate patients to seek lower cost treatment to avoid cost penalties appear to be more effective in directing patient choices than offering the gains of small rewards:
What might we conclude? First, even with price tools and now rewards, patients do not choose medical care by price. When they do consider cost it is more often for imaging, a “service” that seems more of a commodity, than surgery that is more a bespoke service or relationship. There is a term for this, the elasticity of price – how your demand changes with rising and lowering prices. It should be no surprise that healthcare is inelastic; higher prices do not automatically result in less utilization. Healthcare for all the effort is still not viewed as a commodity, although that is changing for “low touch” services like vaccinations or minor injuries where experience and relationship are not often considered.
The studies of reference pricing, where you pay the cost over and above, what the insurance deems usual and customary, has resulted in savings of 15%. But that model supports healthcare disparities, creating tier of care based on ability to pay more. The carrot of a reward program, saving 2%, seems to be ineffective in the continued presence of high deductible and co-payment sticks. As the debate about pharmaceutical prices intensifies, keep those 2% savings in mind. It seems a lot closer to how we actually behave than the wave of the hand political promises of greatly increased saving from price transparency.
Aside from price elasticity, the relatively small influence of monetary awards over penalties can largely be chalked up to a real world application of prospect theory from behavioral economics, which is perhaps better known as loss-aversion theory. Here, when people are given a choice where they can either experience a gain or avoid a loss of equivalent value in taking a risk with equal probability, most will choose to avoid the loss. The following video from the Khan Academy explains the concept:
With medical treatment, the patient's psychological stakes may be much bigger in making their decisions depending upon their perception of the seriousness of the procedure, which may account for why so many were less willing to choose lower cost options for surgery than they were for the more "commodity-like" MRIs.
It would be really interesting to find out what reward level might be needed to equalize the outcomes for savings between the stick and the carrot approach. Better still, would an insurer accept breaking even on the early transactions it might use to steer patients toward lower cost treatment options in the carrot approach if it could succeed in establishing long term relationships between its covered patients and those qualified providers that would save them money in the long run? Then for its customers who prefer higher cost treatment options, allow them to keep utilizing them, but for a higher cost that matches their expense with their preference. If that doesn't trigger their loss aversion instinct, at least the cost of it would be covered....
That would be the game theory solution. Of all of economics, the behavioral branch is perhaps the most dismal, which is saying quite a lot!
On a lighter note, we'll close with a relevant editorial cartoon from more than 100 years ago!...

Image Credit: rawpixel
Labels: economics, health, health insurance
When we first visualized the long-term trends for American household spending through 2017, we couldn't help but notice how similar the trends were for the expenditures on Entertainment and on Health Insurance & Medical Expenses over much of that period, or really, from 1984 through 2008, after which, they diverged. The following chart zeroes in on the average annual expenditures that an estimated 130,001,000 American household "consumer units" spent on these two major categories from 1984 through 2017, where we've identified the primary contributing factor to that outcome.

In the next chart, we look at the same expenditures as a percentage of the total annual average expenditures of an American household consumer unit, this time, without the annotations identifying the Affordable Care Act as the primary contributor to the escalation in health care costs that caused the two household expenditures to diverge.

In the third chart, we drilled down into the subcategories of health care expenditures to break out the average amount that American household consumer units have spent on health insurance, medical services, medical supplies, and drugs to see how they've changed after 2008, which is when one or more of these expenses began to explode.

Wasn't the Affordable Care Act supposed to bend the cost curve for health insurance in the other direction?
Clearly, that didn't happen, where we find the cost of health insurance has continued to grow at similar rates after spiking in 2014 with the 2013 implementation of the Affordable Care Act (while implemented in 2013, much of the increased cost associated with the ACA began to be incurred by U.S. households in 2014). Here's a neat chart that accompanied a September 2017 Motley Fool article showing what has happened to the average cost of health insurance coverage for American families from 2008 through 2017:
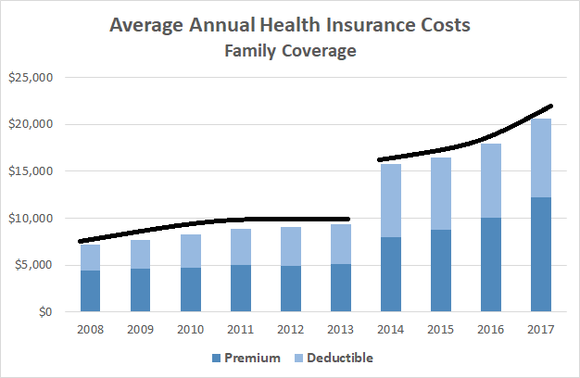
The important thing to recognize about all this data on the runaway cost of health insurance being paid by American households since the Affordable Care Act was signed into law and especially since it was implemented is that it is entirely attributable to actions taken by President Obama while in office for his signature domestic policy "achievement", which also encompassed the setting of health insurance 2017's premiums and deductibles, and also the Affordable Care Act's main enrollment period for that upcoming year.
If President Trump has done anything to influence health insurance costs, it hasn't shown up in any of this data yet. We'll have to wait to September 2019 when the results of the Consumer Expenditure Survey for 2018 become available to find out what that may be!
Data Sources
U.S. Bureau of Labor Statistics and U.S. Census Bureau. Consumer Expenditure Survey. Multiyear Tables. [PDF Documents: 1984-1991, 1992-1999, 2000-2005, 2006-2012, 2013-2017]. Reference Directory: https://www.bls.gov/cex/csxmulti.htm. Accessed 11 September 2018.
Labels: health insurance, personal finance
Did the Affordable Care Act (a.k.a. "Obamacare") succeed in making health care more affordable for the average American household?
Data from the Consumer Expenditure Survey says... no!
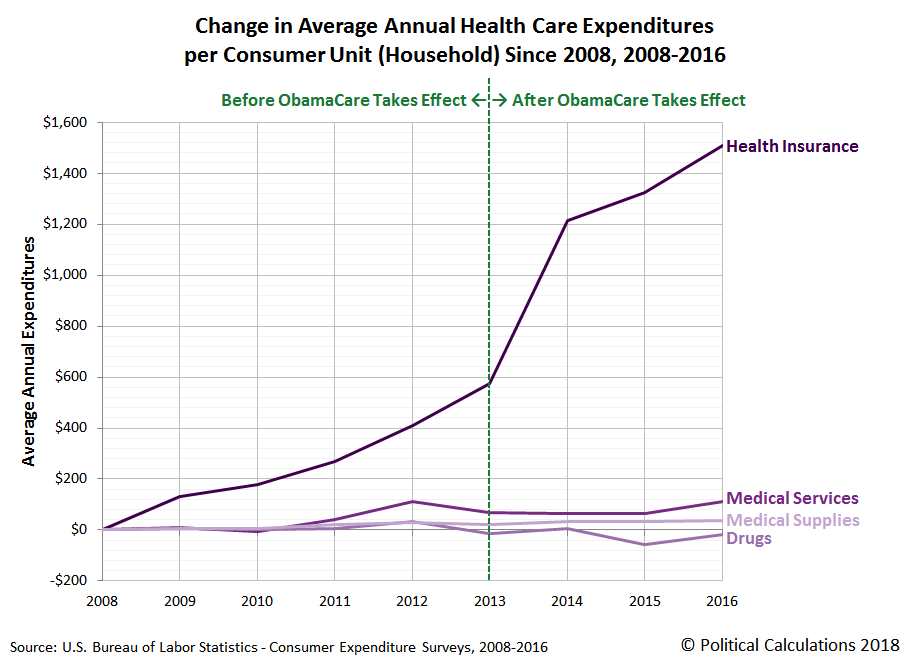
Update 1 June 2018: The vertical dashed line in the chart indicates a break in the U.S. Census Bureau's methodology for collecting information about health insurance coverage that was implemented after 2013, where data in the periods before and after this change are not strictly comparable to each other. That said, the Consumer Expenditure Survey's data since 2013 confirms that the Affordable Care Act has failed to restrain the growth of average health insurance costs by American households during the period that it has been in effect.
Although the chart above focuses on what happened after it took effect, in reality, the health care cost curve began bending upward almost immediately after the Affordable Care Act was passed in 2010, leaving millions of Americans who had been promised by the ACA's supporters that it would reduce the cost of their health insurance sorely disappointed.
But that disappointment didn't extend to the people who owned stock in the U.S.' major health insurers, such as Centene (NYSE: CNC), United Healthcare (NYSE: UNH), WellCare (NYSE: WCG), Cigna (NYSE: CI), Humana (NYSE: HUM), Aetna (NYSE: AET), Molina (NYSE: MOH) and Anthem (NYSE: ANTM), where the Affordable Care Act has been a government-granted license to print money since it went into effect after 2013....

References
U.S. Bureau of Labor Statistics. Consumer Expenditure Survey. Multiyear Tables. [PDF Documents: 2008-2012, 2013-2016]. Accessed 28 May 2018. [Note: Data for 2017 will become available in September 2018.]
Afterword
Added 4 June 2018: Here's a neat chart that accompanied a September 2017 Motley Fool article by Keith Speights:
The cost of health insurance, both in premiums and in deductibles, jumped considerably after 2013 when the Affordable Care Act went into effect.
Labels: data visualization, health care, health insurance, personal finance
Last summer, we wrote about what is perhaps the most boring topic ever: reinsurance, which is, of course, insurance for insurers.
So yes, it sounds boring and, truth be told, it is boring. Yet we were intrigued by how this very boring insurance product could potentially solve a problem that President Obama's signature domestic policy, the Affordable Care Act, has proven itself to be incapable of solving: how to lower health insurance premiums to make them affordable while guaranteeing coverage regardless of pre-existing conditions. Here's how we described its potential for fixing the obvious deficiencies of the federal government health insurance scheme popularly known as Obamacare:
This is where the concept of reinsurance might provide a solution to the problem of costly customer pools for health insurers. What if every customer was initially covered by health insurance policies as if they had no pre-existing condition, but which would make full payouts to the patient so that they could cover the actuarial lifetime cost of having a condition after being diagnosed? Including if they had costly and chronic conditions, which could involve big payouts for the insurers.
The kind of payouts that would be provided through reinsurance policies taken out by the health insurers themselves. Because the money is paid out to the policy holding customer, say into their Health Savings Account, both they and the health insurer would effectively never have to bother with their having a pre-existing condition again, because it has already been accounted for. The same would be true if they were to change health insurers, where the new health insurer could afford to disregard the costs of their pre-existing condition because the customer's previous insurer had already covered it.
Believe it or not, one of the advantages of having the Obamacare death spiral underway is that the people still seeking Affordable Care Act health insurance coverage would constitute a high-risk pool - one that can be separated from the main bulk of the health insurance market making it possible for health insurers to offer lower cost insurance coverage to healthier Americans who were driven out of Obamacare because of skyrocketing premiums.
It certainly would be better than the situation we have today, where Obamacare premiums and costs to U.S. taxpayers can only rise because of the Affordable Care Act's inherent death spiral problem. We would expect it to be a major part of any legislation that might be introduced to repair Obamacare's multitude of defects.
At the time we wrote that, we were unaware that a few states, such as Minnesota, were about to try to use reinsurance pools as a way to stop Obamacare's health insurance premiums from continuing to skyrocket for their residents. Not quite the way that we described would be most optimal, but certainly enough to have an effect.
Data provided by the Urban Institute confirms that reinsurance pools work, not only stopping the death spiral of increasing health insurance premiums, but even reversing them. The following chart presents the Urban Institute's health insurance data for the average monthly insurance premiums of the lowest-cost "Silver" plan in Minnesota for each health insurance coverage year from 2014 through 2018.

The introduction of reinsurance pools in Minnesota, which came despite strong opposition from the state's Democratic party minority in the legislature and went on to pass into law without the signature of the state's Democrat governor, succeeded in reversing the rapid escalation of average health insurance premiums in the state, where they declined by nearly 15% in 2018.
Not quite achieving affordability at an average premium of $365 per month, but certainly an improvement over the average $429 monthly premium that preceded it in the year before the state's reinsurance pools came into existence, which reflected the death spiral effect catching up to Minnesota's Affordable Care Act health insurance premiums.
What will be interesting to see next is how other states might choose to add reinsurance pools to improve the affordability of health insurance premiums for their residents. It is certainly appears to be a step in a better direction.
References
The following articles, presented in chronological order, provide background on how Minnesota's reinsurance pools became law in the state.
Blotz, Tim. MNSure rebate and reform bill. KMSP. [Online Article]. 19 January 2017.
Montgomery, David. Minnesota lawmakers hope ‘reinsurance’ will help fix health insurance market. Here’s how it would work. Pioneer Press. [Online Article]. 19 January 2017.
Bauman, Christine. MN GOP Passes Healthcare Reinsurance Bill Through House. Alphanews. [Online Article]. 15 March 2017.
Pugmire, Tim. Senate passes plan to aid health insurers. MPR News. [Online Article]. 16 March 2017.
McCann, Bailey. Minnesota Passes Healthcare Reinsurance Bill. CivSource. [Online Article]. 3 April 2017.
Nelson, Peter. Minnesota's reinsurance program helps calm health care rates. Minneapolis Star Tribune. [Online Article]. 4 August 2017.
Political Calculations. Reinsurance. [Online Article]. 24 August 2017.
Dayton, Mark. Letter to Thomas E. Price, Secretary of U.S. Department of Health and Human Services. Governor, State of Minnesota. [PDF Document]. 19 September 2017. Note: Though Governor Dayton had opposed the reinsurance bill that became law, and refused to sign the bill directly into law, he recognized that it would be successful in reducing health insurance premiums in Minnesota, which is evident in the opening paragraphs of this September 2017 letter to Health and Human Services Secretary Tom Price, and which perhaps explains why he allowed the bill that he and his political party opposed to pass into law when he could otherwise have vetoed it.
Holahan, John, Blumberg, Linda J., and Wengle, Eric. Changes in Marketplace Premiums, 2017 to 2018. Urban Institute. [PDF Document]. 21 March 2018.
Ollove, Michael. To Curb Rising Health Insurance Costs, Some States Try ‘Reinsurance Pools’. Pew Charitable Trusts Stateline. [Online Article]. 9 April 2018.
Labels: health insurance

Since a handful of congressional Republicans proved to be unprincipled in failing to follow through on their campaign promises to repeal and replace Obamacare, the name by which the Affordable Care Act is better known, that extremely flawed law will still be with us in 2018. Here in 2017, that means that millions of Americans will once again have to make a choice about what is really more affordable for them: paying for subsidized health insurance premiums or paying Obamacare's extra income tax, and they'll have to do it between now and 15 December 2017.
We can help! We've been proud to offer a unique tool that subsidy-eligible American consumers can use to help decide what the right choice is for themselves in shopping for health insurance with respect to their personal financial situation and their health.
That tool will tell you whether it makes more financial sense to buy health insurance through the Obamacare exchanges or to opt out and pay higher income taxes instead, depending upon whichever of these options is less costly for you.
That a choice that millions of Americans have made after performing similar calculations on their own in recent years after comparing how actually "affordable" the costs of the Affordable Care Act's health insurance policies are with whatever additional tax they might otherwise have to pay after considering the state of their health. The New York Times described the personal finance problem that millions of Americans are facing back in 2016:
Clint Murphy let the deadline for getting health insurance by the new year pass without a second thought.
Mr. Murphy, an engineer in Sulphur Springs, Tex., estimates that under the Affordable Care Act, he will face a penalty of $1,800 for going uninsured in 2016. But in his view, paying that penalty is worth it if he can avoid buying an insurance policy that costs $2,900 or more. All he has to do is stay healthy.
"I don't see the logic behind that, and I’m just not going to do it," said Mr. Murphy, 45, who became uninsured in April after leaving a job with health benefits to pursue contract work. "The fine is still going to be cheaper."...
[...]
People, like Mr. Murphy, who earn too much to qualify for federal subsidies that defray the cost of coverage may be most likely to opt out. A recent analysis by the Kaiser Family Foundation found that more than seven million people who are eligible for exchange coverage would pay less in penalties than for the least expensive insurance available to them. More than half would not qualify for subsidies, the analysis found.
Our tool below will help you decide which option is more affordable for you in 2018. You can obtain the relevant health insurance policy cost information you need from either the Healthcare.gov web site, or more reliably, from the independent and far more transparent Health Sherpa site.
Also, if you're accessing this tool on a site that republishes our RSS news feed, please click here to access a working version of our tool.
For the 2018 calendar year, the default data we used in our tool is taken from approved health insurance premiums and the second lowest silver plan cost in the District of Columbia. The annual income is for a 27-year old minimum wage earner in Washington D.C. in 2017, assuming they are employed full time, year-round. As you can see from the results for that default data, if they can reasonably expect to remain healthy in 2018, they will be better off in choosing to pay the additional income tax rather than be burdened with the costly subsidized premiums of either the lowest cost "silver" health insurance plan or even the lowest cost "bronze" plan available to them.
About This Tool
In building this tool, we've made a handful of assumptions. Here they are, along with links to our references for data:
- The federal government's poverty income thresholds for 2017 will apply for the 2018 calendar year.
- The Kaiser Family Foundation's description of how ObamaCare's subsides will be calculated is accurate.
- The map of states we used to identify which are expanding their eligibility for their Medicaid programs up to 138% of the federal poverty income threshold applies for 2017. The results for states that have changed their Medicaid expansion status in years prior to 2017 will not be accurately reflected [a quick and easy workaround to get accurate results is to select a different state that shared the same status in your year of interest].
- CNNMoney's description of how the penalty tax will work is accurate.
- Sean Parnell of The Self-Pay Patient blog identified an exemption from the tax that we originally missed - it turns out that people who live in regions where the lowest-cost Bronze plan is more than 8% of their household income even after the subsidy will be fully exempt from the tax! (Of course, you realize that means that skipping out on not paying health insurance too until they might actually need it just became an even more attractive option for those who will be fully exempt from the tax!)
- The default values associated with selecting the "United States" are those that will apply for a majority of the nation's population. The list of Medicaid-expansion states is that for 2017, so if you select earlier years, the results will be based on the 2017 map.
- People will mostly act rationally where their financial incentives and the assessment of their health care needs are involved.
Beyond this, we've assumed that for some people there may be a "gray area", who would only have a small incentive to not purchase health insurance, where any benefit in doing so is not very large with respect to their household income, and where the decision to buy or not buy should instead be based upon an assessment of what the buyer's actual health care needs for their household will be in the near term, rather than purely upon its cost with respect to the ObamaCare income tax.
Mathematically, we've defined that gray area as being equal to the difference between the penalty tax they might choose to pay or an amount equal to 3.1% of their income before taxes, which closely corresponds to the average expenditure of U.S. households for health insurance, according to the Consumer Expenditure Survey report for 2012.
Legal Disclaimer
Materials on this website are published by Political Calculations to provide visitors with free information and insights regarding the incentives created by the laws and policies described. However, this website is not designed for the purpose of providing legal, medical or financial advice to individuals. Visitors should not rely upon information on this website as a substitute for personal legal, medical or financial advice. While we make every effort to provide accurate website information, laws can change and inaccuracies happen despite our best efforts. If you have an individual problem, you should seek advice from a licensed professional in your state, i.e., by a competent authority with specialized knowledge who can apply it to the particular circumstances of your case.
Labels: health insurance, personal finance, risk, tool
There really isn't anything much more boring than insurance, except perhaps discussions about insurance.

So that's why we're going to go meta and crank the knob of boringness all the way to 11 and discuss insurance for insurers, which is better known as reinsurance!
Reinsurance is a tool that insurance companies use to cover the cost of big payouts to their customers if they should experience an unexpectedly large number of claims or perhaps just some very large claims. Or both, as can often occur with a large scale natural disaster, such as a hurricane or an earthquake, where they can use their reinsurance policy to come up with the large sums of money that they need to pay out on short notice to make their customers whole.
It's a deadly dull business, but it's also a big business - and in the case of one of America's biggest billionaires, their main business.
We're thinking about reinsurance today because of the growing death spiral dynamic in Obamacare, where the original defects written into the law are contributing to adverse selection, where rising premiums are driving healthy Americans out of the market while the people who actually buy the Affordable Care Act's subsidized health insurance are the ones who need and use it more because they're sicker.
That dynamic is leading health insurers to adopt strategies that either boost their premiums to cover the cost of their sicker-than-average population of customers or to develop low quality health insurance coverage that is specifically designed to be undesirable to such customers as a way to screen them out in the market.
Part of the dilemma here is that the Affordable Care Act requires health insurers to sell health insurance to everyone, regardless of whether they have any costly pre-existing conditions, and then limits how much they can charge. That combination, combined with the death spiral dynamic, is a major reason why health insurers are increasingly leaving the Affordable Care Act's exchanges, where the cost of doing business is often greater than their revenue from the business.
This is where the concept of reinsurance might provide a solution to the problem of costly customer pools for health insurers. What if every customer was initially covered by health insurance policies as if they had no pre-existing condition, but which would make full payouts to the patient so that they could cover the actuarial lifetime cost of having a condition after being diagnosed? Including if they had costly and chronic conditions, which could involve big payouts for the insurers.
The kind of payouts that would be provided through reinsurance policies taken out by the health insurers themselves. Because the money is paid out to the policy holding customer, say into their Health Savings Account, both they and the health insurer would effectively never have to bother with their having a pre-existing condition again, because it has already been accounted for. The same would be true if they were to change health insurers, where the new health insurer could afford to disregard the costs of their pre-existing condition because the customer's previous insurer had already covered it.
Believe it or not, one of the advantages of having the Obamacare death spiral underway is that the people still seeking Affordable Care Act health insurance coverage would constitute a high-risk pool - one that can be separated from the main bulk of the health insurance market making it possible for health insurers to offer lower cost insurance coverage to healthier Americans who were driven out of Obamacare because of skyrocketing premiums.
It certainly would be better than the situation we have today, where Obamacare premiums and costs to U.S. taxpayers can only rise because of the Affordable Care Act's inherent death spiral problem. We would expect it to be a major part of any legislation that might be introduced to repair Obamacare's multitude of defects.
Labels: health insurance
Welcome to the blogosphere's toolchest! Here, unlike other blogs dedicated to analyzing current events, we create easy-to-use, simple tools to do the math related to them so you can get in on the action too! If you would like to learn more about these tools, or if you would like to contribute ideas to develop for this blog, please e-mail us at:
ironman at politicalcalculations
Thanks in advance!
Closing values for previous trading day.
This site is primarily powered by:

CSS Validation

RSS Site Feed

JavaScript
The tools on this site are built using JavaScript. If you would like to learn more, one of the best free resources on the web is available at W3Schools.com.
Other Cool Resources
Blog Roll


