The rate at which carbon dioxide accumulates in the Earth's atmosphere is directly affected by human activities. Increasingly, that measure tells us about human activities in China, the world's biggest source of carbon dioxide emissions by a widening margin.
But it's not the only contributor. Environmental events like El Niño can also lead to additional increases in the amount of carbon dioxide measured in the atmosphere.
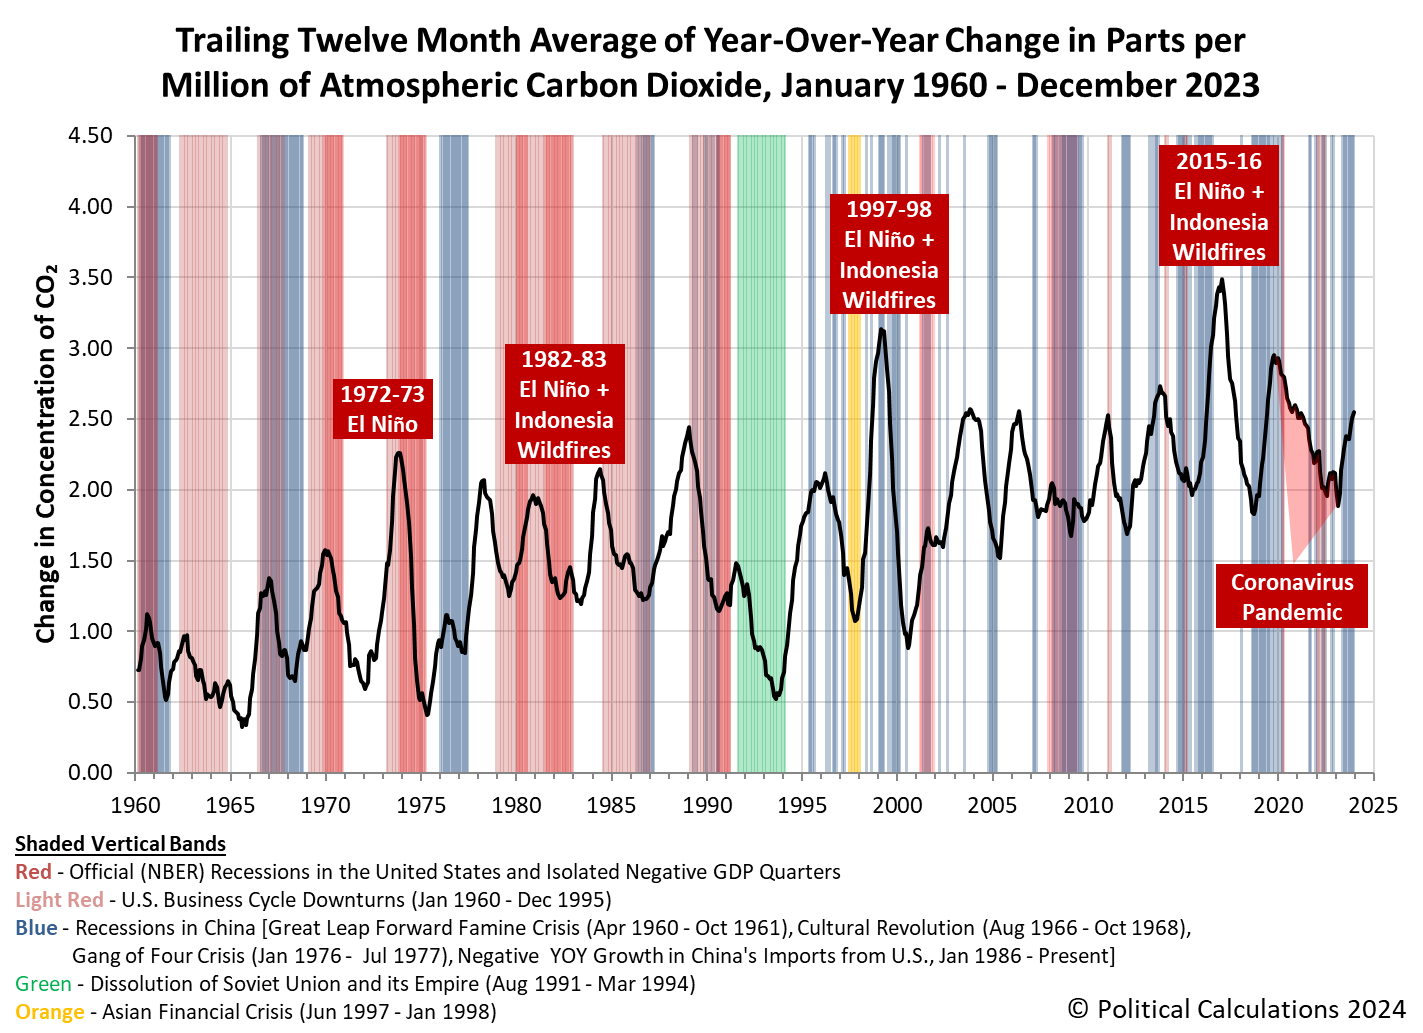
In December 2023, the trailing twelve month average of the year-over-year change in the concentration of carbon dioxide measured in the Earth's atmosphere rose by 2.55 parts per million, the highest level recorded since December 2020. Not uncoincidentally, China's other exports increased for a second month as the Chinese economy showed signs of recovery following several sluggish months.
The following chart presents the trajectory of CO₂ accumulation in the Earth's air against the context of major economic and environmental events during the 21st Century:
For greater context, let's expand the picture to cover the period since January 1960!
We've made a point of emphasizing El Niño events since we're currently living through one, which took hold in May 2023. Hopefully, the world will escape the surge of CO₂ addition that comes from El Niño drought-worsened wildfire events in Indonesia that produced the biggest spikes recorded in the pace of atmospheric CO₂ accumulation since 1960. At this point, it hasn't contributed much excess CO₂ to the atmosphere, but it is apparently flirting with becoming a "super El Niño" that may have a bigger impact.
References
National Oceanographic and Atmospheric Administration. Earth System Research Laboratory. Mauna Loa Observatory CO2 Data. [Online Data]. Updated 5 January 2024.
Image credit: Microsoft Bing Image Generator. Prompt: "El Niño causing drought in Indonesia leading to wildfires."
Labels: economics, environment
Welcome to the blogosphere's toolchest! Here, unlike other blogs dedicated to analyzing current events, we create easy-to-use, simple tools to do the math related to them so you can get in on the action too! If you would like to learn more about these tools, or if you would like to contribute ideas to develop for this blog, please e-mail us at:
ironman at politicalcalculations
Thanks in advance!
Closing values for previous trading day.
This site is primarily powered by:
CSS Validation
RSS Site Feed
JavaScript
The tools on this site are built using JavaScript. If you would like to learn more, one of the best free resources on the web is available at W3Schools.com.


