
About two-thirds of 2025 has come and gone. If your projected income for the year will push you into a higher tax bracket before it ends, you still have time to act to avoid that outcome.
As tax-related problems go, this is a good one to have. In this situation, your goal is to maximize the amount of money that you will keep under your control. If your income is on track to exceed a threshold that will put you into a higher tax bracket, Uncle Sam will take a bigger bite out of what you earn and that's what you want to avoid.
The first step to see if you'll even have this as a potential problem is to estimate what your total income for the year will be. After you've done that, you'll want to estimate your taxable income, which is really easy. If you will be filing a single return, just subtract 2025's standard deduction of $15,000 from your total projected income. If you will file a joint return, subtract the standard deduction of $30,000 from your combined income.
Have your number? See how your taxable income fits within the following ordinary income tax brackets for single and joint filers:
| Entry Level Taxable Income for U.S. Ordinary Income Tax Brackets | ||
|---|---|---|
| Income Tax Bracket (Tax Rate) | Single Filer Taxable Income Needed to Enter Bracket | Joint Filer Taxable Income Needed to Enter Bracket |
| 10% | $0 | $0 |
| 12% | $21,926 | $23,851 |
| 22% | $48,476 | $96,951 |
| 24% | $103,351 | $206,701 |
| 32% | $197,301 | $394,601 |
| 35% | $250,526 | $501,051 |
| 37% | $626,351 | $751,601 |
The thing you're looking for is whether your taxable income is above the entry level taxable income for a given tax bracket. If it is, all income you earn will above that number will be taxed at a higher rate. Unless you act to reduce your taxable income to put it into the next lower tax bracket.
Charles Schwab's Hayden Adams has some suggestions to do that, using a hypothetical taxpaying scenario:
Let's say Ben, a single filer, is on track to make $242,000 in 2025. After factoring in the $15,000 standard deduction and a $19,360 contribution to a pre-tax 401(k), Ben's taxable ordinary income is $207,640 for the year ($242,000 minus $19,360 minus $15,000). At that level of income, $10,340 of taxable income would fall into the 32% ordinary income tax bracket (which kicks in after $197,300 of income). Here are some ways Ben could reduce his income:
- Boost 401(k) contribution. The limit for 2025 is $23,500 for those under 50, so Ben contribute an additional $4,140 his 401(k). Plus…
- Maximize contributions to an HSA. The limit for 2025 is $4,300, so making the max contribution would reduce Ben's income even further (assuming he is eligible). Plus…
- Tax loss harvesting. Up to $3,000 of net capital losses can be used to offset ordinary income, so if Ben harvesting at least $1,900 in losses he would wipe out the income that falls into the 32% tax bracket.
"401(k)" refers to the popular retirement investment account many Americans have available through their employers, in which they set aside a "pre-tax" percentage of their income. "HSA" is a reference to a tax-exempt Health Savings Account that you would most likely also have through your employer.
Tax loss harvesting however is a whole different thing. It requires you to have investments outside of your 401(k) or HSA accounts. And if the name of the concept doesn't give it away, it requires you to lose money on at least part of your investments in that account to claim as losses on your income tax return to offset your taxable income.
Finally, Adams' hypothetical taxpayer is pretty well to do, but engaging in this kind of lawful taxable income management can pay off for people with much lower incomes. If Ben's projected taxable income for 2025 were just above the $48,476 threshold for the 22% threshold, then Ben would have a very powerful incentive to reduce his taxable income. The jump in tax rate from the 12% bracket to the 22% bracket is the largest in the tax tables, so if Ben's taxable income is within striking distance of $48,476 for the options available to him, anything he can do to reduce his taxable income below that level would be very beneficial in avoiding Uncle Sam taking too big a bite out of the income he earns.
Image Credit: Microsoft Copilot Designer. Prompt: "An editorial cartoon of a taxpayer trying to prevent Uncle Sam from taking too much of their income". Which we followed up with "Make it more colorful".
Labels: ideas, income, personal finance, taxes


What is the median income earned by individual Americans in each U.S. state? And how does your income compare to it?
We can help you answer one of those questions! On 9 April 2024, the U.S. Census Bureau released its Occupational Employment and Wage Statistics data for incomes earned by individual Americans in May 2023. We extracted the data for the median (and average) incomes earned by individuals employed in all occupations for each of the fifty states and created the following interactive map to present it. If you're accessing this article on a site that republishes our RSS news feed, you may need to click through to our site to access a working version.
We'll be discussing the April 2024 estimates for median household income for the entire United States in the near future, but if you're okay with spoilers, Motio Research has already reported their estimate for April 2024 is $78,230.
Reference
U.S. Census Bureau. Occupational Employment and Wage Statistics. State (May 2023). [ZIP File (Excel Spreadsheet)]. 9 April 2024.

Labels: demographics, income
The U.S. Census Bureau has released its annual estimate of the median income earned by the United States 131,202,000 households in 2021. At $70,784, the annual income earned by a typical American household increased by $2,774 (or 4.1%) from 2020 to 2021. Adjusted for President Biden's inflation however, real median household income fell by $402 year-over-year from 2020 in terms of constant 2021 U.S. dollars.
We've added the U.S. Census Bureau's annual data to our chart comparing the various available sources for U.S. median household income data that track this demographic characteristic on a monthly basis. The updated chart compares their nominal, noninflation-adjusted estimates over the period they overlap from January 2006 through July 2022.
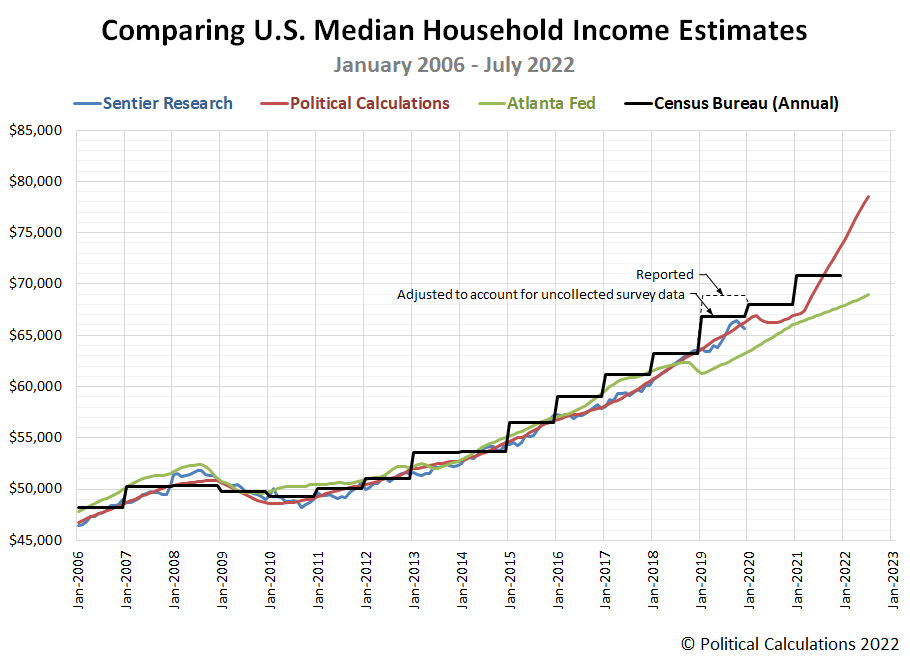
In incorporating the U.S. Census Bureau's annual data in this chart, we've annotated the anomaly for 2019's median household estimate. Here, the Census Bureau's median household income estimate for 2019 was greatly impacted by the arrival of the coronavirus pandemic in March 2020, coinciding with the period in which it surveyed U.S. households about the income they earned in 2019. Lockdown measures imposed by several state goverments, including the high population states of California and New York, blocked the Census Bureau from successfully collecting as much data as they intended, particularly from lower-income earning households. In a working paper, Census Bureau analysts confirm the coronavirus pandemic reduced the number of responses to the Annual Social and Economic Survey used to collect household income data, which they believe biased the median household income figure upward by 2.8%. Our chart shows both the Census Bureau's reported figure of $68,703 and indicates the adjusted figure of $66,779 for that year.
Comparing the Census Bureau's annual estimates with the monthly estimates, we find that all these estimates range within a few percent of each other from January 2006 through October 2018. After that point, there's a major divergence between the Atlanta Fed's estimates and the others, where we continue to note the following three differences:
- The Atlanta Fed's estimates understate the rising trend for median household income observed in 2019.
- They also completely miss the impact and recovery from the coronavirus recession in 2020.
- They significantly understate the robust growth in median household income we've observed since March 2021.
That difference, particularly with the U.S. Census Bureau's annual data, is growing much more substantial as time passes.
Political Calculations' estimates of median household income generally tracks with Sentier Research's estimates up through the period where they terminate in December 2019. The analysts who founded Sentier Research after retiring from the U.S. Census Bureau went on to permanently retire in 2020 and Sentier Research is no longer an operating entity.
For the latest in our coverage of median household income in the United States, follow this link!
The Bureau of Economic Analysis will soon be releasing a major revision of its historic income data. Since Political Calculations uses this data in generating its monthly household income estimates, the chart above represents a snapshot of our estimates compared with other sources "before" the revised data becomes available.
References
Federal Reserve Bank of Atlanta. Home Ownership Affordability Monitor (U.S. Census Bureau American Community Survey One-Year Estimates of Median Household Income, Projected to Indicated Month by Atlanta Fed Staff using additional data produced by the Current Population Survey and Decennial Census). [Online Database]. Accessed 23 September 2022.
Sentier Research. Household Income Trends: January 2000 through December 2019. [Excel Spreadsheet with Nominal Median Household Incomes for January 2000 through January 2013 courtesy of Doug Short]. [PDF Document]. Accessed 6 February 2020. [Note: We've converted all data to be in terms of current (nominal) U.S. dollars.] Note: Sentier Research is no longer an operating entity, we've linked to the Internet Archive's copy of this final report.
Political Calculations. Median Household Income in July 2022. [Online Article]. 1 September 2022.
U.S. Census Bureau. Historical Income Tables: Households. Table H-5. Race and Hispanic Origin of Householder -- Households by Median and Mean Income. [Excel Spreadsheet]. 13 September 2022.
Jonathan Rothbaum and Adam Bee. Coronavirus Infects Surveys, Too: Survey Nonresponse Bias and the Coronavirus Pandemic. U.S. Census Bureau Working Paper Number SEHSD WP2020-10. [PDF Document]. 30 March 2021.
Update 2 October 2022
The BEA's annual data revision for 2022 has been released. It's much smaller in scale and scope than it might have been, covering the period from January 2017 through July 2022. We created the following animation to show how the revision changed Political Calculation's median household income estimates over this period.

The effect of the data revision can be divided into two periods. From January 2017 through February 2021, the size of revisions were very small, with data during 2020 seeing the largest changes in the form of upward revisions with a magnitude of +0.2%. Much larger changes are concentrated in the period from March 2021 through July 2022 however, which were revised downward by progressively increasing amounts. The smallest revision in this second period was for March 2021, which was unchanged, the largest revision was for July 2022, which was reduced by $1,000. We'll have more analysis when we present the median household estimate for August 2022 on 4 October 2022.
Update 26 July 2023
Going back over the comparison and looking at how the estimates have progressed since we originally wrote this, we're thinking our estimates started running hot in early 2021. What we're seeing is similar to how our estimates behaved after the relationship between trailing year average earned income per capita and median household income changed as a result of the Census Bureau's March 2015 survey revision, but this time, coinciding with the post-pandemic recovery, which is a pretty exciting development. Unfortunately, we'll need to wait until 2022's annual median household income data becomes available sometime in September 2023 to have enough data to quantify how hot the estimates are running and to find out how the relationship they're based upon may have changed.
Check this out - the month-over-month change in the trailing year average earned income per capita really took off in early 2021:
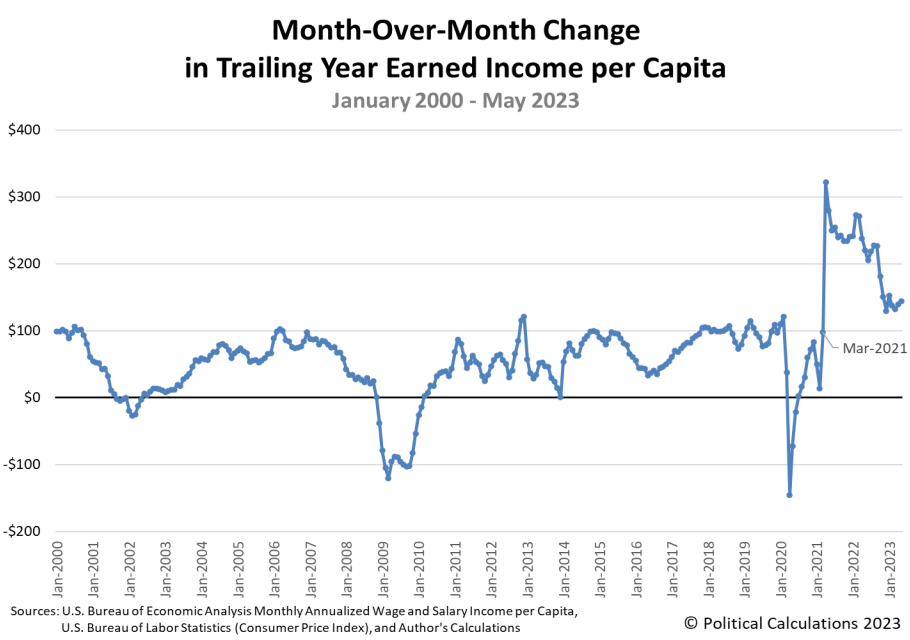
What's more, it looks like it's growing faster than what median household income appears to be based on the Census Bureau's annual 2021 estimate, which suggests that relationship has changed. If so, what our monthly estimates are really showing is what median household income would look like if the median household income was keeping up with the increases in average per capita income the way it was up through March 2021!
Labels: data visualization, demographics, income, median household income
Americans saw both their average nominal and inflation-adjusted income per capita rise for the first time since February in July 2022.
Political Calculations' initial estimate of the average per capita income of Americans in July 2022 is $34,400, a $330 (or nearly 1%) increase from June 2022's estimate of $34,030. The following chart tracking the average individual earned income during the Biden era shows the increase in both nominal and inflation-adjusted terms.
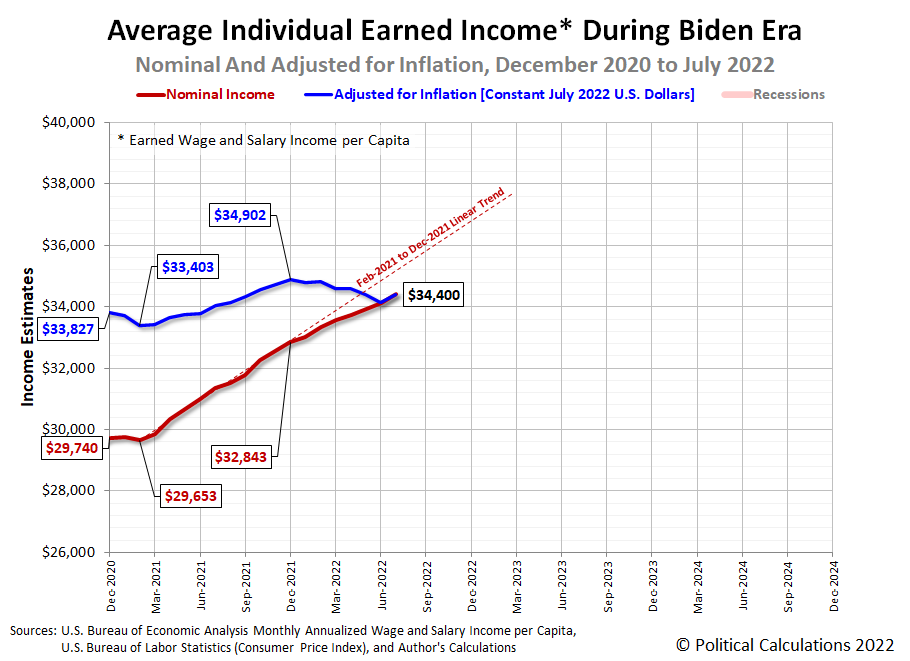
In terms of constant July 2022 U.S. dollars, July 2022's average per capita income of $34,400 falls $502 below December 2021's peak of $34,902. By contrast, nominal average per capita income increased by $1,557 since the end of 2021. That difference means that all of the nominal gain in the average wage and salary income earned by Americans was entirely eroded by inflation during 2022.
We'll be looking at the latest update to the trends for median household income through July 2022 tomorrow.
References
U.S. Bureau of Economic Analysis. Table 2.6. Personal Income and Its Disposition, Monthly, Personal Income and Outlays, Not Seasonally Adjusted, Monthly, Middle of Month. Population. [Online Database (via Federal Reserve Economic Data)]. Last Updated: 26 August 2022. Accessed: 26 August 2022.
U.S. Bureau of Economic Analysis. Table 2.6. Personal Income and Its Disposition, Monthly, Personal Income and Outlays, Not Seasonally Adjusted, Monthly, Middle of Month. Compensation of Employees, Received: Wage and Salary Disbursements. [Online Database (via Federal Reserve Economic Data)]. Last Updated: 26 August 2022. Accessed: 26 August 2022.
U.S. Department of Labor Bureau of Labor Statistics. Consumer Price Index, All Urban Consumers - (CPI-U), U.S. City Average, All Items, 1982-84=100. [Online Database (via Federal Reserve Economic Data)]. Last Updated: 10 August 2022. Accessed: 10 August 2022.
Labels: data visualization, income
Trends in how Americans' incomes are changing can tell us quite a bit about the relative health of the U.S. economy. One of the simplest measures we can follow is the country's average earned wage and salary income per capita. The following chart shows that data from January 2000 through May 2022, covering the 21st century to date:

The chart tracks both nominal and inflation-adjusted income trends. One thing we quickly see is that official periods of recession coincide with significant or sustained declines in average inflation-adjusted earned income (the blue line). Meanwhile, average nominal income, shown in red, either stalls or falls during these periods.
So what does that mean for the state of today's economy? The next chart zooms in the period since December 2020, covering the Biden era:

Here, we see the growth rate of average nominal incomes has notably slowed since December 2021, while inflation-adjusted incomes have sustained declines during this period. What that means is the U.S. economy has definitely slowed during the last two quarters, but the trend for nominal income growth hasn't fully stalled out yet as of the available data for May 2022. Meanwhile, the decline in real earned incomes since December 2021 is consistent with recessionary conditions being present in the U.S. economy during this period.
We should note the underlying income data is subject to revision for many months after it is first reported. The initial estimates for June 2022 will be reported by the U.S. Bureau of Economic Analysis near the end of July. If you want to beat us to the punch in doing that analysis, the References section below provides links to the data you'll need to both replicate and update our results.
References
U.S. Bureau of Economic Analysis. Table 2.6. Personal Income and Its Disposition, Monthly, Personal Income and Outlays, Not Seasonally Adjusted, Monthly, Middle of Month. Population. [Online Database (via Federal Reserve Economic Data)]. Last Updated: 30 June 2022. Accessed: 30 June 2022.
U.S. Bureau of Economic Analysis. Table 2.6. Personal Income and Its Disposition, Monthly, Personal Income and Outlays, Not Seasonally Adjusted, Monthly, Middle of Month. Compensation of Employees, Received: Wage and Salary Disbursements. [Online Database (via Federal Reserve Economic Data)]. Last Updated: 30 June 2022. Accessed: 30 June 2022.
U.S. Department of Labor Bureau of Labor Statistics. Consumer Price Index, All Urban Consumers - (CPI-U), U.S. City Average, All Items, 1982-84=100. [Online Database (via Federal Reserve Economic Data)]. Last Updated: 10 June 2022. Accessed: 10 June 2022.
2022 is shaping up to be a very bad year for average Americans. President Biden's inflation is eating away at the incomes earned by average Americans.
Although the beginning of that inflation traces back to the passage of the American Rescue Plan Act of 2021 on 11 March 2021, the lifting of state and local COVID lockdowns throughout 2021 initially allowed the average of Americans per capita wage and salary income to increase faster than the inflation Biden's wasteful stimulus fueled. But in 2022, inflation has risen faster.
The following chart shows that effect playing out. Adjusted for inflation, the average earned income for Americans (shown as the blue line) peaked in December 2021, falling in each month since.

One of the more interesting aspects of the inflation unleased in the U.S. is how different it is from what other nations are experiencing. The Financial Times' Robert Armstrong explains how its different in nature from what the Eurozone is experiencing (boldface emphasis ours):
After the eurozone printed record inflation yesterday, Tyler Cowen had some questions. Why, the economist asked at his excellent Marginal Revolution blog, is European services inflation, at 3.8 per cent in May, running so hot? In the absence of a jumbo-sized American fiscal stimulus package, the European inflation story so far has been about scarce energy. But why should that spell pricier services?
Good questions. So we put them to a few sharp minds on the eurozone. Here are some answers.
First and foremost, hot eurozone inflation is still about energy. Energy prices pass into other prices. This is plain to see in the spread between eurozone headline and core inflation. Pull out food and energy, and eurozone inflation drops four percentage points....
With energy stubbornly expensive, inflation in services categories such as transport and housing have picked up. But there is another piece to this. Prices in areas such as recreation, hotels and restaurants are rising fast too, as Europe enters its first post-Covid summer in several years. Supply is still clearly the dominant factor, but demand is starting to matter too.
This might look uncomfortably close to US inflation, where narrow pandemic-specific inflation gave way to broad price increases. But the comparison is imprecise. For instance, Europe is seeing some goods inflation in areas such as vehicle prices, but nothing like the American dash for used cars. Much of Europe's goods inflation is imported, while the US experience was all about roaring demand.
The biggest difference is in employment and wages. Tight US labour markets (alongside oodles of excess cash savings) are supporting high demand. Not so in Europe, where household consumption in the key eurozone economies has not recovered from the pandemic, as Tomas Hirst pointed out on Twitter yesterday. Hours worked are below pre-pandemic levels too, suggesting labour market slack. Wages aren't yet a big part of Europe's inflation story.
In sum, the big picture looks like demand-pull inflation in the US and cost-push inflation in Europe.
Which is to say that while the inflation rates now being recorded in the U.S. and the Eurozone may seem similar, that similarity is superficial. Conflating the two experiences is therefore a mistake. The paths taken to get to a similar amount of inflation in both regions result from very different causes.
For the U.S., the "tight US labour markets (alongside oodles of excess cash savings)" Armstrong notes are exactly what President Biden's March 2021 stimulus created. Its generous stimulus checks for millions of American households funded an outsized demand for goods and services at a time its especially generous unemployment benefits ensured the U.S. economy would be starved of productive labor to provide them. That proved to be a recipe for making inflation. The worst inflation in over four decades now eating away at the incomes earned by Americans didn't happen by accident.
Previously on Political Calculations
- Median Household Income in January 2021
- Inflation and Average Earned Income in the U.S.
- Median Household Income in November 2021
References
U.S. Bureau of Economic Analysis. Table 2.6. Personal Income and Its Disposition, Monthly, Personal Income and Outlays, Not Seasonally Adjusted, Monthly, Middle of Month. Population. [Online Database (via Federal Reserve Economic Data)]. Last Updated: 30 July 2021. Accessed: 30 July 2021.
U.S. Bureau of Economic Analysis. Table 2.6. Personal Income and Its Disposition, Monthly, Personal Income and Outlays, Not Seasonally Adjusted, Monthly, Middle of Month. Compensation of Employees, Received: Wage and Salary Disbursements. [Online Database (via Federal Reserve Economic Data)]. Last Updated: 27 May 2022. Accessed: 27 May 2022.
U.S. Department of Labor Bureau of Labor Statistics. Consumer Price Index, All Urban Consumers - (CPI-U), U.S. City Average, All Items, 1982-84=100. [Online Database (via Federal Reserve Economic Data)]. Last Updated: 11 May 2022. Accessed: 11 May 2022.
Labels: economics, income, inflation
Earlier this year, we introduced a new near-real time economic indicator based on average individual earned income. The metric itself is almost as simple as it comes. It is determined by dividing the aggregate received wages and salaries for individuals in the U.S. by the nation's estimated resident population.
That introduction represents a snapshot in time from January 2021. Half a year and a significant revision in the source income data later, we now have data through June 2021. Here's the new snapshot through that more recent point in time, showing all updated data from January 2000 onward.

The updated chart shows some remarkable events, particularly during the coronavirus recession and the period since:
- Nominal (not inflation adjusted) earned income (red) peaked at $29,538 in February 2020 as the U.S. economy peaked just ahead of 2020's coronavirus pandemic lockdowns that threw the nation into recession. They bottomed at $26,479 in April 2020, marking the bottom of the Coronavirus Recession. The inflation-adjusted data (blue) shows nearly the same pattern in 2020. In terms of constant June 2021 dollars, average income per capita in the U.S. peaked at $30,989 in February 2020, bottomed at $28,059 in April 2020.
- Average nominal income recovered to its pre-Coronavirus Recession peak in November 2020, and in December 2020 for the inflation-adjusted data.
- Nominal average earned income per capita has continued to rise to $30,606 through June 2021 based on the month's initial estimate.
- After adjusting for inflation, real average earned income earned income per capita has fallen by 1.6% from its December 2020 peak of $31,119. The bulk of the decline has taken place since January 2021, with high rates of inflation eroding the purchasing power of American wage and salary earners. Their purchasing power is roughly at the level it was in December 2019, despite average earned income per capita in June 2021 being 6% higher than December 2019 in nominal terms.
So what has happened in 2021? Tyler Cowen offers an explanation:
You may remember that I’ve been predicting that repeatedly, while much of “Twitter economics” was suggesting that “running the labor market hot” would boost real wages, I was claiming it was far more likely that rising employment would be correlated with falling real wages. (Try here.) This did not represent any great insight on my part, rather I was simply refusing to make the mood affiliation move of denying the tradeoff, and I had read Keynes’s General Theory. Here is the latest:
Companies big and small are raising wages to attract workers and hold onto employees as the economy revs back into gear.
But those fatter paychecks aren’t going as far, thanks to rising inflation.
In fact, compensation is now lower than it was in December 2019, when adjusted for inflation, according to an analysis by Jason Furman, an economics professor at Harvard University.
The Employment Cost Index — which measures wages and salaries, along with health, retirement and other benefits — fell in the last quarter and is 2% below its pre-pandemic trend, when taking inflation into account. (Wages and salaries are growing at a faster pace than benefits.)
Score one for Keynesian economics > Twitter economics.
Or maybe they didn’t run the labor market hot enough.
Gotta love that last dig!
References
U.S. Bureau of Economic Analysis. Table 2.6. Personal Income and Its Disposition, Monthly, Personal Income and Outlays, Not Seasonally Adjusted, Monthly, Middle of Month. Population. [Online Database (via Federal Reserve Economic Data)]. Last Updated: 30 July 2021. Accessed: 30 July 2021.
U.S. Bureau of Economic Analysis. Table 2.6. Personal Income and Its Disposition, Monthly, Personal Income and Outlays, Not Seasonally Adjusted, Monthly, Middle of Month. Compensation of Employees, Received: Wage and Salary Disbursements. [Online Database (via Federal Reserve Economic Data)]. Last Updated: 30 July 2021. Accessed: 30 July 2021.
U.S. Department of Labor Bureau of Labor Statistics. Consumer Price Index, All Urban Consumers - (CPI-U), U.S. City Average, All Items, 1982-84=100. [Online Database (via Federal Reserve Economic Data)]. Last Updated: 13 July 2021. Accessed: 13 July 2021.
In 2010, U.S. compensation and data software firm Payscale identified the 10 lowest paying college degrees for those starting their first jobs in their fields after graduation. We wondered how on the mark that list was, so we tapped Payscale's 2020 data for starting wages by college major to see if things got relatively better or worse for today's graduates in those fields.
The results are shown in the following chart. The original 2010 data is shown in blue and the newer 2020 data is shown in green. In between, in orange, we've adjusted the 2010 starting salary data for inflation to be in terms of 2020 U.S. dollars to make those older salaries directly comparable to the actual starting pay for graduates in the listed fields in 2020.

After adjusting for inflation, we see only two degrees where the actual starting pay for graduates in 2020 is ahead of 2010's inflation-adjusted level: Athletic Training and Elementary Education. Horticulture comes close to breaking even, so to speak, and the remaining fields would appear to have become even less rewarding.
Of these less rewarding degrees, Culinary Arts presents the biggest gap between 2010's inflation adjusted pay and 2020's actual starting pay, followed by Special Eduation and Paralegal Studies.
In 2010, Payscale also indicated what an individual holding these degrees could expect to make at a mid-career point, some 10 or more years after graduation. Since it's 10 years later, we thought it would be especially interesting to see how 2020's actual mid-career pay compares with 2010's inflation-adjusted mid-career pay. Our results are shown in the next chart:

Once again, the fields of Culinary Arts and Athletic Training come out the furthest ahead after accounting for inflation, but Theology graduates also gained more income than would have been expected based on 2010's inflation-adjusted pay.
Most the other fields saw their 2010 graduates making something within a several percent of their 2010 peers' inflation adjusted pay, with one big exception, which looks like it is in error.
According to Payscale's 2020 survey data, individuals holding degrees in Special Education with 10 or more years of experience saw the average mid-career pay in their field collapse. At $54,500, it is just $700 higher than 2010's non-inflation adjusted pay, some $9,800 below what adjusting the mid-career income for 2010 would predict.
The Bureau of Labor Statistics indicates the median pay for Special Education teachers was $61,420 per year in 2019, which is more in line with Payscale's 2010 inflation-adjusted mid-career income figure.
We sampled other income data for other fields, which appears to be in line with Payscale's surveyed reults, so the 2020 mid-career pay figure for Special Education degree holders appears to be an outlier.
Overall, it appears most of 2010's lowest paying degrees for college graduates turned out to be as bad for pay 10 years later as 2010's data suggested they would be.
Labels: education, income, jobs
The Bureau of Labor Statistics has been tracking the average pay and benefits earned by American workers in all occupations and working in all industries since at least the first quarter of 2004 [1], where we now have nearly 15 years worth of data that indicates how much the average civilian employee in the U.S. has been compensated for their hours worked.
We've visualized the nominal data reported by the BLS in the following chart, where we've presented the average wage or salary and the total benefits earned per hour worked with the combined total compensation earned by civilian workers in the U.S. from 2004-Q1 through 2018-Q3. The data for 2018-Q4 won't be available until 19 March 2019.

From 2004-Q1 to 2018-Q3, the cost to civilian employers in the U.S. of compensating their employees rose from $24.95 per hour to $36.63 per hour, an increase of 47%. Breaking that figure down into its components, hourly wages and salaries rose by 41% from $17.71 to $25.03 over that period, while the value of benefits paid to civilian employees as part of their total compensation rose by 60% from $7.23 to $11.60 per hour.
In our next chart, we're presenting the same quarterly information, but now adjusted for inflation to be in terms of constant 2018-Q3 U.S. dollars.

After taking inflation into account, we find that hourly wages and salaries have risen by 5% from 2004-Q1 to 2018-Q3 and that their benefits have increased by 19%. Together, the inflation-adjsuted total compensation of civilian employees in the U.S. has increased by 9% from 2004-Q1 through 2018-Q3.
Both employers and employees have incentives to favor benefits over wages and salaries in considering how employees will be compensated for their labor, where in particular, the portion of employee compensation that goes toward paying the employer-provided benefit of health insurance is exempt from federal, state and local income taxes.
Notes
[1] On a quarterly basis, following the North American Industry Classification System (NAICS) for tracking costs across various industries. The BLS also has annual employee compensation data going back to 1986 that followed the older Standard Industry Classification (SIC) code system.
References
U.S. Bureau of Labor Statistics. Employment Cost Trends: Employer Cost for Employee Compensation. [Online Database]. Accessed 4 January 2018.
Organization for Economic Co-operation and Development. Main Economic Indicators: Consumer Price Index: Total All Items for the United States (Quarterly, Seasonally Adjusted). [Online Database]. Accessed 4 January 2018.
Labels: business, demographics, income
The U.S. Census Bureau has published its annual report on Income and Poverty in the United States, which we've used to visualize the cumulative distribution of income for U.S. individuals, families and households in the following animated chart. The cumulative income data applies for the 2017 calendar year - if you're looking for income data for the 2018 calendar year, it will not be collected until March 2019 and will not published until September 2019.

We set up the animation to present each of the frames for 7.5 seconds each, but if you'd prefer more time to inspect them, here are links to the static cumulative income distribution charts for U.S. individuals, families, and households.
If you would like to estimate where you fall on the the income distribution spectrum in the U.S. using these charts, all you need to do is find your income on the horizontal axis, trace a vertical line up to where it intercepts the curve on the graph, then trace a horizontal line to the left side of the chart where you can roughly approximate your income percentile ranking on the vertical scale.
But if you would like a more precise estimate, we have updated our "What Is Your Income Percentile Ranking?" tool with the 2017 income distribution data. Our tool can also estimate what your income percentile would have been in any calendar year from 2010 through 2016.
Finally, if you would like more current estimates of median household income, we've been happy to accommodate your information needs since August 2017!

We produced the chart above, covering through July 2018, just a few weeks before the Census Bureau published its annual report for 2017. If you've been following our series, you were not in any way surprised by what the U.S. Census Bureau reported for that year!
Labels: data visualization, income, income distribution, median household income
We've drilled down a bit deeper into the U.S. Census Bureau's data documenting the lifetime income trajectories that Americans have expect based on their level of education.
Previously, we looked just at those trajectories for all Americans with some work experience for the years from 2000 through 2016, which includes the data for Americans who work part time, who may only work part of a year, who may have exited the workforce, whether temporarily, such as to focus on raising children or because of layoffs or other job changes, or permanently, such as through retirement.
Now, we're focusing like a laser beam on Americans who work full-time, year-round and, as a bonus, we've expanded the data in our analysis to include all the years for which the Census Bureau has provided this information in a convenient digital format, which is to say since 1994. Our first chart shows the mean lifetime income trajectories for various levels of educational attainment for these full-time, year-round workers:

This chart reveals a clear difference in the education level-based lifetime income trajectories that Americans who work full-time, all year-round, where those who can sustain working at this pace can expect to have, on average, higher lifetime incomes with higher levels of educational attainment.
That income differentiation also carries from the very outset of their adult working lives, where incomes rise with higher levels of education. The following chart shows this data for 2016, which until September 2018 when the data for 2017 will be made public, represents the most recent year for which this data is available.

The pattern shown in the first chart is persistent from year-to-year in the Census Bureau's historical data, which provides confidence that the survey data is capturing the average lifetime income trajectories of Americans who work full-time, year-round. As an example of this persistence, the following chart shows the age-based incomes as a percentage of the mean income of the Age 18-24 cohort for Bachelor degree holders who work full-time, year-round.

While there is considerable variation from year to year, the overall pattern for lifetime income trajectories holds across the various levels of educational attainment and over what is now more than two decades worth of income data.
References
U.S. Census Bureau. Current Population Survey Tables for Personal Income. PINC-04. Educational Attainment--People 18 Years Old and Over, by Total Money Earnings, Work Experience, Age, Race, Hispanic Origin, and Sex. Both Sexes, All Races. Worked Full Time, Year Round. [Digital files: 1994, 1995, 1996, 1997, 1998, 1999, 2000, 2001, 2002, 2003, 2004, 2005, 2006, 2007, 2008, 2009, 2010, 2011, 2012, 2013, 2014, 2015, 2016]. Accessed 19 August 2018.
Labels: data visualization, demographics, education, income, income inequality
How will your annual income change over your life?
That's a difficult, if not impossible, question to answer for an individual, considering that it depends upon specific details like your education, your experience, whether you work, how often you might change jobs, experience a layoff, get promoted, when you retire, et cetera. Statistically however, we can get a pretty good idea from income data collected by the U.S. Census Bureau.
We recently completed a project where we looked at income data for the total population for every year from 2000 through 2016, where we found a pretty unique pattern hidden within each year's data - the average income for the reported age groups follows a fairly predictable and stable trajectory from year to year.
In the following chart, we've graphed four curves, where each curve corresponds to a different level of educational attainment. To generate each trajectory, for each level of education in each year, we first converted the average incomes listed for each age group into a percentage of the average income reported for the Age 18-24 cohort. We then calculated the average percentage income for each age group over all the years from 2000 through 2016.

For each data point, the "Reference Age" in the horizontal axis represents the middle of the age cohort for which the income data was reported, which for Age 18-24 is 21, for Age 25-29 is 27, and so on....
Right away, you can see the similarities between the income trajectories by age, which all fall within a relatively narrow range of one another. And that's despite the great differences between the average incomes reported for each education level for the Age 18-24 cohort, which we've indicated for 2016 in the inset in the chart above.
What kind of difference does that base average income set by education level have on a the average American's lifetime income trajectory and earnings?
In the next chart, we do the math, pairing the 2016 average income of the Age 18-24 group with the average income trajectories for all years from 2000 through 2016.

The curves for each education level don't match the actual income trajectories of each for 2016, but they're not all that far off either.
Labels: data visualization, demographics, education, income
How much of the total revenue of a business makes it into its employees pockets? How much goes to other businesses? How much goes to the federal government? And how much does the business itself keep?
The following Sankey diagram visualizes the answers those questions in percentage terms for the average business operating in the United States, where all the indicated values are given as a percentage of total business revenue.

In the chart, where taxes are concerned, we're focusing on money that goes to the national U.S. government through federal withholding income taxes and payroll taxes, or that are directly paid to the federal government by U.S. businesses, where we're not considering either state-level taxes or local taxes. Consequently, the amount of money that goes to people who actually earn incomes is less than indicated.
That said, here are the answers to the four questions we asked at the beginning:
- Less than half (48.7%).
- Less than one-fifth (18.6%).
- Over a quarter (27.6%).
- About $1 in every $20 (5.1%).
An important thing to keep in mind in considering these percentages is that they're based on figures that were captured for the entire U.S. economy. As such, the average flow they indicate will be skewed, much the same way that the average annual income of a line of 10 people queued up at a Starbucks would be if Amazon's Jeff Bezos was standing in it.
As an example of that effect, consider that the median income earner probably isn't taking home 6.3% of business revenue in the form of dividends. Much of that money is really going to business owners who choose to take their incomes in the form of dividends rather than as salaries, and also to investors, which includes a large number of former wage and salary earners who seek dividend income to support their retirement.
The chart also illustrates how the federal government taps into business revenues at multiple points to fund itself, which independently don't seem like they claim very high percentages, but when combined, reveals that it takes a larger share of business revenue than stays with businesses in the private sector.
For our part, this was an interesting exercise in data visualization, where the chart above is little more than a first cut at telling a bigger story. We'll be curious to see how others might model these kinds of flows.
References
Bolton, Patrick, Mehran, Hamid and Shapiro, Joel. Executive Compensation and Risk Taking. Federal Reserve Bank of New York Staff Reports. Staff Report No. 456. [PDF Document]. June 2010. Revised November 2011.
U.S. Bureau of Economic Analysis. National Income and Product Accounts Tables. Table 1.12. National Income by Type of Income. [Online Database]. Accessed 24 June 2018.
U.S. Bureau of Labor Statistics. Employer Costs for Employee Compensation - December 2015. [PDF Document]. 10 March 2016.
Internal Revenue Service. Statistics of Income, 2015. Figure E. Total Income Tax, Tax Years 2014 and 2015. [PDF Document]. September 2017.
Labels: business, data visualization, income, math, taxes
The U.S. Census Bureau has published its annual report on Income and Poverty in the United States, which we've used to visualize the cumulative distribution of income for U.S. individuals, families and households in the following animated chart!

The cumulative income data applies for the 2016 calendar year, which the Census Bureau collected through its March 2017 survey sample, which they processed and published on 12 September 2017. Income data for the 2017 calendar year will not be collected until March 2018 and not published until September 2018.
If you would like to see static versions of the cumulative income distribution charts in the animation above for individuals, families and households, we can accommodate you! If you would like to estimate where you fall on the the income distribution spectrum in the U.S. using these charts, all you need to do is find your income on the horizontal axis, trace a vertical line up to where it intercepts the curve on the graph, then trace a horizontal line to the left side of the chart where you can roughly approximate your income percentile ranking on the vertical scale.
If you would like a more precise estimate, we have updated our "What Is Your Income Percentile Ranking?" tool with the 2016 income distribution data. Our tool can also estimate what your income percentile would have been in any calendar year from 2010 through 2015.
Labels: data visualization, income, income distribution, median household income
In June 2017, Sentier Research served notice that it would suspend its reporting of monthly median household income estimates, where its final report would present the median household income for May 2017. Here's how they signed off their final report in their long-running series:
This will be our final report in the monthly series of median household income. We can no longer afford to provide these estimates given our current level of resources. We believe, as we hope you do, that these estimates provided an important new dimension regarding the economic situation of American households as we slowly climbed out of the Great Recession. The story continues but we must move on. Our hope is that someone will be able to continue this work. Should you or someone you know be interested please contact us.
Today, Political Calculations is ready to step in and fill the gap left behind by the original work of Sentier Research. We've developed an alternative method of estimating each month's median household income, which is based upon the monthly population and aggregate personal wage and salary income data reported by the U.S. Bureau of Economic Analysis.
We use that data to calculate the U.S.' Wage and Salary Income per Capita for each month. In the following chart, we show the results of that math for each month from January 1999 through May 2017, along with the entire series of monthly median household income estimates provided by Sentier Research for each month from January 2000 through May 2017.

In looking at this chart, we realized that changes in the level of the Wage and Salary Income per Capita appeared to lead changes in the Median Household Income figures reported by Sentier Research. It occurred to us that we might see the data sync-up better if we calculated the trailing year average of the Wage and Salary Income per Capita figures, which would also smooth out some of the noisy variation in that data. The following chart shows our results for doing just that math, where we've shown the trailing year average Wage and Salary Income per Capita data from January 2000 through May 2017, which already appears to better match up with the available data that we have for the unchanged Median Household Income estimates.

The next chart reveals the correlation that we discovered by plotting the Median Household Income data against the Trailing Year Average Wage and Salary per Capita.

That large concentration of points that you see in the center of the linear trend is the rise and fall of incomes during the years leading up to, continuing through, and extending after the official period of the Great Recession, mainly between January 2006 and January 2011.
As linear regression analysis goes, what we see in the chart represents an outstanding result right out of the gate. So much so, that we've built a tool to do the indicated math. The default data in the following tool applies for June 2017 (if you're reading this article on a site that has republished our RSS news feed, please click through to our site to access a working version of the tool).
Our median household income estimate for June 2017 is $58,257. This figure is slightly higher than the estimate of $58,184 that our regression analysis indicates for May 2017. After accounting from month-over-month inflation, as measured by the Consumer Price Index, we find that there really hasn't been much of a significant change.
That May 2017 figure compares with Sentier's estimate for May 2017 of $59,345, which is about 2% higher than the value that we obtained with our method. Speaking of which, we found that 70% of Sentier's reported data for January 2000 through May 2017 falls within one standard deviation of our regression model trend, 96% is within two standard deviations, and all data points fall within three standard deviations. That pattern is consistent with the residual data following a standard normal, bell-curve type Gaussian distribution.
What that all means is that we can successfully estimate the Median Household Income figure that Sentier Research would have found using their methods with a relatively low margin of error, where our linear regression-derived estimate will almost always fall within 3% of the results of Sentier Research's median household income estimate, and within 1% just over two-thirds of the time. When you consider things like sampling errors and other statistical factors like compositional changes within U.S. households over time that would affect the accuracy of Sentier's income estimates, our results will very much be in the right ballpark.
If someone else picks up Sentier's mantle and methodology for generating monthly median household income estimates, we'll be happy to feature their work! Until then, we're happy to fill in the gap left behind by Sentier's exit from producing their median household income estimates, and in fact, because we've made a tool to do our math directly available to you, if the data is available, you don't even need to wait for us or anyone else to generate it. We just ask that you provide a link back to the original post or provide an appropriate citation when you write up your results so that others can take advantage of our tool.
Data Sources
U.S. Bureau of Economic Analysis. Table 2.6. Personal Income and Its Disposition, Monthly, Personal Income and Outlays, Not Seasonally Adjusted, Monthly, Middle of Month. Population. [Online Database (via Federal Reserve Economic Data)]. Last Updated: 1 August 2017. Accessed: 1 August 2017.
U.S. Bureau of Economic Analysis. Table 2.6. Personal Income and Its Disposition, Monthly, Personal Income and Outlays, Not Seasonally Adjusted, Monthly, Middle of Month. Compensation of Employees, Received: Wage and Salary Disbursements. [Online Database (via Federal Reserve Economic Data)]. Last Updated: 1 August 2017. Accessed: 1 August 2017.
Sentier Research. Household Income Trends: January 2000 through May 2017. [Excel Spreadsheet with Nominal Median Household Incomes for January 2000 through January 2013 courtesy of Doug Short]. [PDF Document]. Accessed 22 June 2017. [Note: We've converted all data to be in terms of current (nominal) U.S. dollars.]