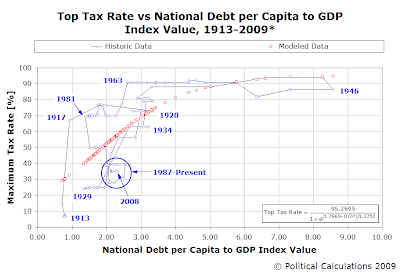
Here on the cusp of Tax Day 2009, we thought it might be fun to find out if there's a relationship that exists between the size of the national debt and the maximum income tax rates in the United States since the income tax was first introduced in 1913.
To find out, we've adapted our DTIP index, which adjusts the relative size of the national debt with respect to the size of the economy (as measured by GDP) and the size of the population. As we've noted previously, this index gives a pretty good indication of a nation's level of distress, as determined by how willing its political leadership is to take on significant levels of debt. Our data for the U.S. national debt, GDP and population is available here.

Looking at the data, we also see another remarkable pattern. Using our modeled data points as a dividing line, we see that extraordinarily high income tax rates (those above the S-shaped curve formed by the modeled red data points) most often coincide with periods in which the U.S. presidency is held by members of the Democratic Party, while those data points below the modeled most often coincide with periods in which the U.S. presidency is held by members of the Republican Party.
Taking the data we have through 7 April 2009, with a national debt level of $11.15 trillion USD, an estimated population of 306,170,293 and assuming zero economic growth for the first quarter of 2009 (keeping GDP at the fourth quarter of 2008's level of $14.2 trillion), we find that the DTIP ratio has increased to 2.56. Using the relationship we found between the top U.S. income tax rate and the level of national debt per capita adjusted for GDP, we find the corresponding top income tax rate to be 62.1%.
We therefore find that given the extreme amounts of debt being taken on by the current administration and also its political affiliation, we believe that the top income tax rates in the United States will rise substantially from established plans to increase this maximum level from 35% to 39.6% in 2010. These top tax rates could well double once the full impact of the increased level of spending is taken into account, as significantly higher rates will be needed to underwrite the additional level of borrowing to ensure the solvency of the United States government.
Unless, of course, they're planning to just print lots of money instead.
Update 14 April 2009: Corrected our projected maximum income tax rate above for 7 April 2009 from 69.6% to 62.1%.
Labels: national debt, taxes
Welcome to the blogosphere's toolchest! Here, unlike other blogs dedicated to analyzing current events, we create easy-to-use, simple tools to do the math related to them so you can get in on the action too! If you would like to learn more about these tools, or if you would like to contribute ideas to develop for this blog, please e-mail us at:
ironman at politicalcalculations
Thanks in advance!
Closing values for previous trading day.
This site is primarily powered by:
CSS Validation
RSS Site Feed
JavaScript
The tools on this site are built using JavaScript. If you would like to learn more, one of the best free resources on the web is available at W3Schools.com.