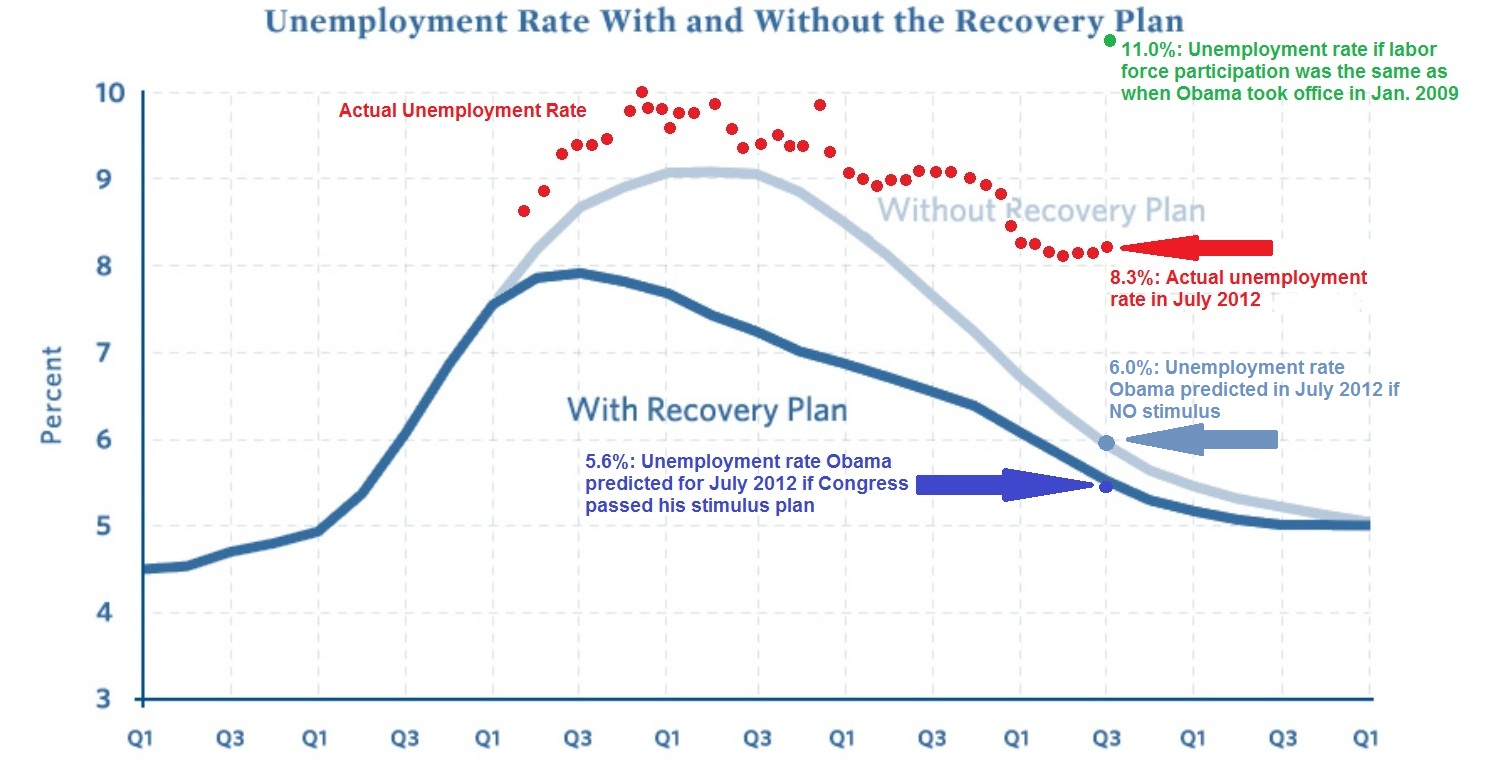
James Pethokoukis has the latest version of the chart originally created by Geoff at Uncommon Misperceptions, to which he's added a new wrinkle in its latest update: the green data point showing what the U.S. unemployment rate would be, if only the labor force participation rate had not fallen so much from where it was in January 2009 when Barack Obama was sworn into the presidency.
We thought we'd put that data point to the test. But, being us, we'd do the same math covering all the time since January 2002, just over 10 years ago, just to see how we had arrived at that point. Our results, showing the effects of keeping the U.S.' labor force participation rate at a constant 65.7% of the U.S. population, are below:
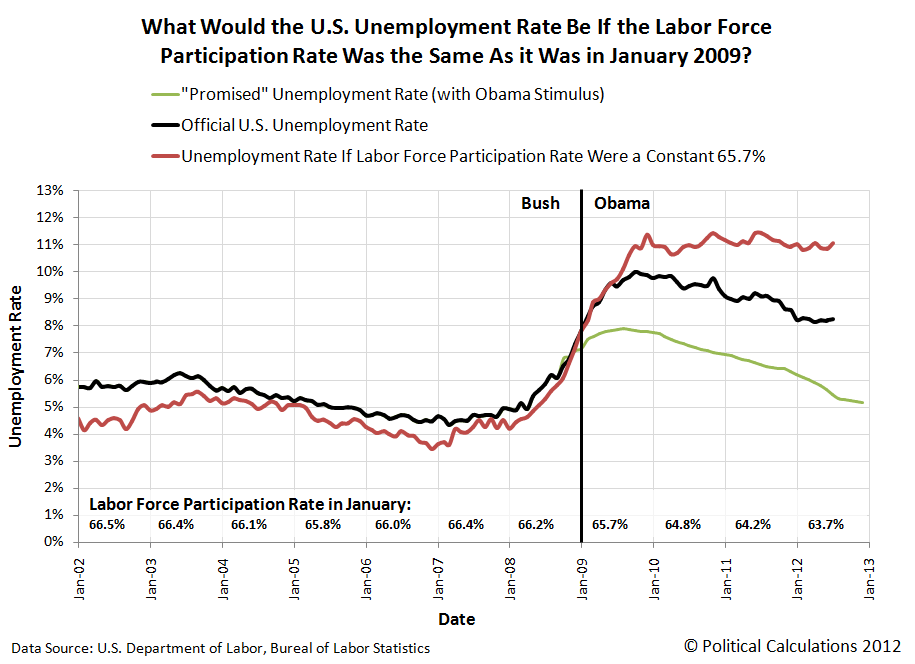
What we find suggests that there might indeed be something to the President's apparent belief that his economic plan has worked, although only half as well as intended, it seems:
Here, we observe that the actual trajectory for the U.S. unemployment rate largely parallels the one he and his economic planners centered in Washington D.C. desired. Since the actual trajectory for the U.S. unemployment rate requires a significant decline in the United States' labor force participation rate in order for it to have fallen as it has, we must assume that was their intention.
The only problem for President Obama and his economic team is that too few Americans chose to exit the U.S. civilian labor force as they desired. In order to have achieved their goals, they would have needed to remove an additional 2% of the U.S. working age population from the ranks of the nation's civilian labor force.
That would be on top of the 2% of the U.S. working age population that they successfully removed from the U.S. work force since January 2009. With the current civilian labor force participation rate standing at 63.7%, that additional 2% reduction in the number of Americans in the civilian labor force works out to be roughly an additional 4.9 million people.
What can we say? Apparently, the President and his team have decided that culling the U.S. work force is a lot easier for them to do than generating real job-creating economic growth.
Labels: data visualization, jobs
Welcome to the blogosphere's toolchest! Here, unlike other blogs dedicated to analyzing current events, we create easy-to-use, simple tools to do the math related to them so you can get in on the action too! If you would like to learn more about these tools, or if you would like to contribute ideas to develop for this blog, please e-mail us at:
ironman at politicalcalculations
Thanks in advance!
Closing values for previous trading day.
This site is primarily powered by:
CSS Validation

RSS Site Feed
JavaScript
The tools on this site are built using JavaScript. If you would like to learn more, one of the best free resources on the web is available at W3Schools.com.
Other Cool Resources
Blog Roll


