Several weeks ago, something was very wrong with the Department of Labor's reporting of new jobless claims, as it seemed the number of layoffs in the U.S. were consistent with a booming economy. Here is Scott Sumner's take on the data:
Six weeks ago I did a post on the puzzling fall in unemployment claims:
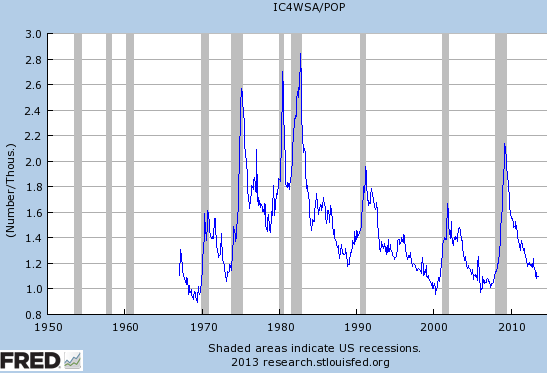
The new claims for unemployment this week was a shockingly low 320,000, bringing the 4 week average down to 332,000
335,000, which is the lowest since October 2007. This graph shows the ratio of the 4 weeks average to US population (times 1000 to make it easier to read.)
The most recent week on the graph is at about 1.1, but today’s figures are at 1.049
1.058, if they were added. This means the ratio of new claims to pop is roughly back to the boom levels of 1999-2000 and 2006-07. And yet the other indicators (total jobs, unemployment rate, etc), remain deeply depressed.I’m not going to redraw the graph, but with today’s numbers (308,000 on the 4 week average) we have fallen below the 0.1% level, meaning that fewer than 1/1000ths of Americans now file for unemployment comp each week. That’s not just boom conditions, it’s peak of boom conditions. The only other times this occurred since 1969 (when unemployment was 3.5%) were just a few weeks at the peak of the 2000 tech boom and a few weeks at the peak of the 2006 housing boom. In other words, the puzzle is now even greater than 6 weeks ago, as the unemployment rate is still at recession levels (7.3%.) Something very weird is going on in the labor markets.
I don’t have any good ideas. Perhaps employers are reluctant to add workers for some reason (Obamacare?) and instead work them overtime more. Then when demand falls instead of laying off workers, they cut overtime. But I don’t recall the average workweek numbers being all that unusual.
The solution to the mystery of the missing layoffs turned out to be a lot more mundane than an economy suddenly and unexpectedly operating at peak-of-boom performance or the pernicious influence of Obamacare. It turns out that the State of California's Employment Development Department, a government agency with a history of incompetence, was once again failing to process hundreds of thousands of new jobless claims in a timely manner, just as it did a year earlier. The difference this time is that government agency's management, who have never been disciplined for their incompetence, blamed their latest claims processing problems on the implementation of new software.
The bottom line is that California's failure to process new applications for unemployment insurance benefits for newly laid off workers in the state sharply skewed the national data downward. And then, because the state had to play catch up after it "belatedly" discovered its problems, those numbers were inflated in the weeks following the state agency's now annual display of ineptitude.
So, to cut through the noise, we treated all of the data from 7 September 2013 through 19 October 2013 as if it were outliers in the national data. The chart below shows the current trend for new jobless claims as best as we determine it:

Overall, we see the layoff situation in the United States as being flat-to-mildly improving since the current trend was established on 23 February 2013, as the number of new layoffs nationally is falling at an average rate between 300 and 500 per week.
We're just happy to say the mystery of new jobless claims is solved!
Welcome to the blogosphere's toolchest! Here, unlike other blogs dedicated to analyzing current events, we create easy-to-use, simple tools to do the math related to them so you can get in on the action too! If you would like to learn more about these tools, or if you would like to contribute ideas to develop for this blog, please e-mail us at:
ironman at politicalcalculations
Thanks in advance!
Closing values for previous trading day.
This site is primarily powered by:
CSS Validation

RSS Site Feed
JavaScript
The tools on this site are built using JavaScript. If you would like to learn more, one of the best free resources on the web is available at W3Schools.com.
Other Cool Resources
Blog Roll


