Correlation doesn't prove causation, but make of the following charts what you will. Our first chart shows how much U.S. businesses have paid in both payroll employment taxes and the corporate income tax as a percentage share of GDP in each year from 1960 through 2012 (now corrected to show through 2012 - the original version through 2010 is here):
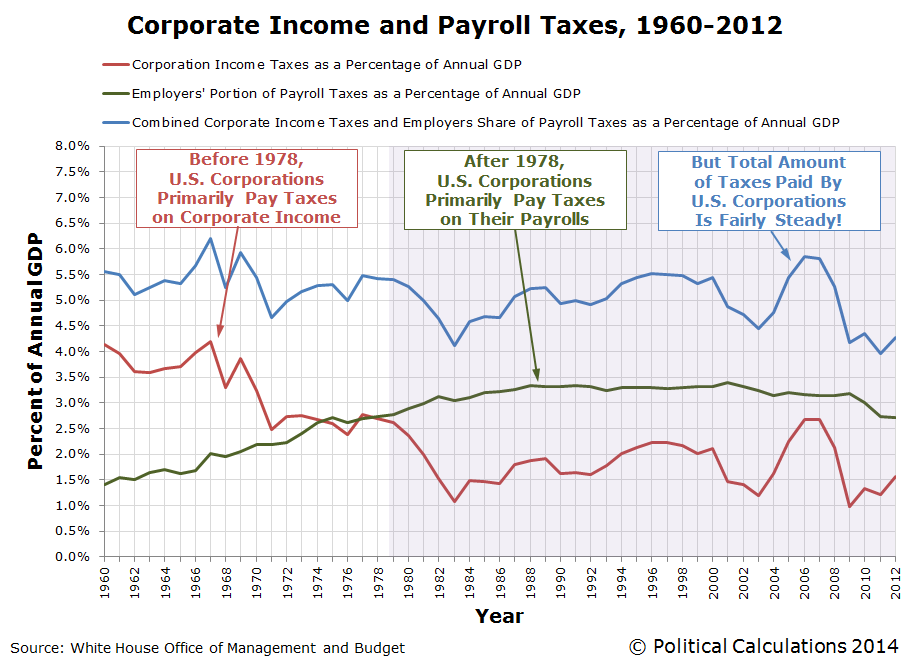
This chart shows that the total amount of taxes paid by businesses to the U.S. federal government has remained fairly steady as a percentage share of GDP from 1960 through 2012, but the composition of the taxes they pay has changed over time. Before 1978, U.S. businesses paid more in corporate income taxes than in payroll taxes, but since 1978, they have consistently paid considerably more in the form of payroll taxes.
The reason why that changed after 1978 was a series of increases in the employer's portion of Social Security payroll taxes, which were offset by reductions in corporate income taxes. During that time, employers went from having their payrolls taxed at a rate of less than 5% before 1978 to be increased in steps every several years to reach a much higher rate of 6.2% beginning in 1990, where it has held level since. Social Security's tax rates were increased during these years to ensure that the program would remain solvent.
What kind of effect do you think those tax hikes would have had on U.S. businesses, where suddenly, it became a much larger penalty to have lots of people on their payrolls in the United States? And what about those businesses where it really doesn't matter that the jobs be done inside the U.S., like manufacturing?
Think about those questions when you consider our next graph:
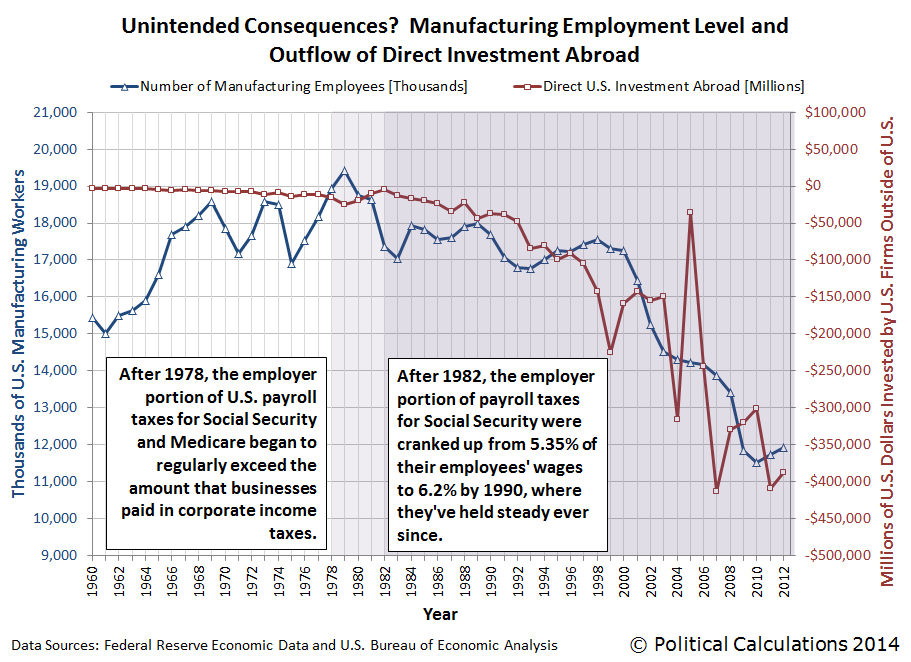
What we see in this chart is that increases in the amount of money being directly invested by U.S. firms abroad (shown as a negative value on the right hand scale, since it is an outflow for the U.S. economy), largely coincides with and is generally proportional to the change in the number of Americans employed in manufacturing. It's as if U.S. manufacturing firms, in seeking to avoid having to pay higher taxes that would put them at a disadvantage with their competitors by reducing the number of people on their payrolls, shifted their production to be outside of the U.S. as they invested in new production facilities elsewhere in the world.
As a result, the U.S. federal government, in hiking its payroll taxes on U.S. businesses so much, actually drove jobs out of the U.S. instead because it overly penalized employing workers within the U.S. In the process, it lost the tax collections that would have come from those relatively high paying jobs, not to mention potentially lowering the nation's GDP below what it might have been otherwise.
But as they say around the White House these days, since those Americans are no longer trapped in their high-paying manufacturing jobs as they were given the opportunity to pursue their dreams, they're much better off now.
Data Sources
White House Office of Management and Budget. Budget of the U.S. Government, Fiscal Year 2014, Historical Tables. Table 1.2 and 2.1. [PDF Document]. 10 April 2013.
Federal Reserve Bank of St. Louis. Federal Reserve Economic Data. All Employees: Manufacturing (MANEMP), Thousands, Monthly, Seasonally Adjusted. [Online Database]. Accessed 15 February 2014.
Bureau of Economic Analysis. U.S. International Transactions Accounts Data. Table 1. U.S. International Transactions [Millions of dollars], Line 51. Excel Spreadsheet]. Accessed 15 February 2014.
Labels: jobs, satire, social security, taxes
Welcome to the blogosphere's toolchest! Here, unlike other blogs dedicated to analyzing current events, we create easy-to-use, simple tools to do the math related to them so you can get in on the action too! If you would like to learn more about these tools, or if you would like to contribute ideas to develop for this blog, please e-mail us at:
ironman at politicalcalculations
Thanks in advance!
Closing values for previous trading day.
This site is primarily powered by:
CSS Validation

RSS Site Feed
JavaScript
The tools on this site are built using JavaScript. If you would like to learn more, one of the best free resources on the web is available at W3Schools.com.
Other Cool Resources
Blog Roll


