One of the most important and perhaps least well known metrics for the U.S. stock market is the growth rate of dividends for the S&P 500, which is why we started a new series to feature it last year.
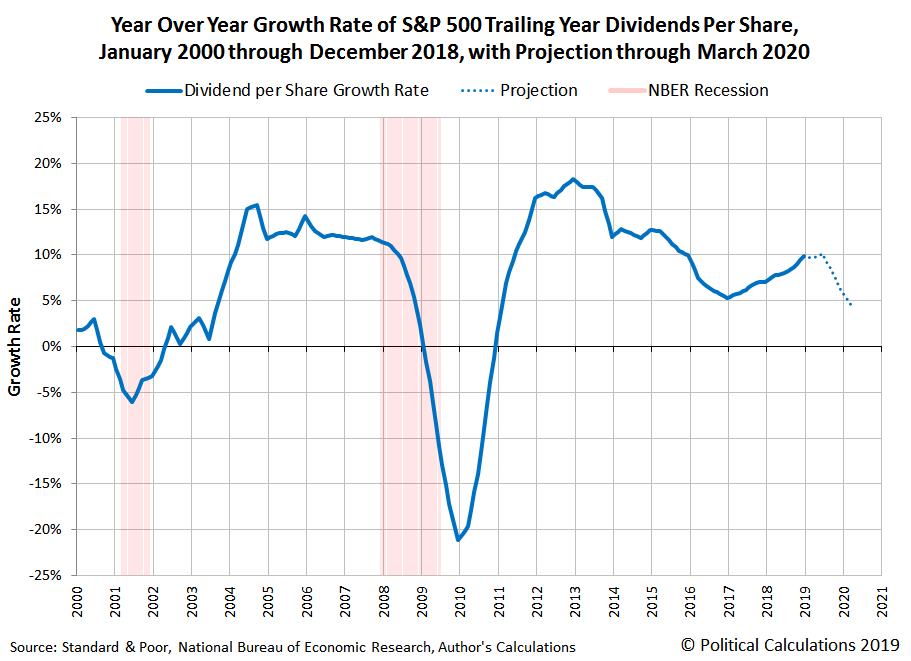
The following chart visualizes the year over year growth rate of the S&P 500's trailing year dividends per share for each month of the 21st Century, starting from the beginning of the last year of the 20th Century and continuing through December 2018, with a bonus projection of the currently expected future for S&P 500 dividend growth through March 2020.
We've also indicated the National Bureau of Economic Research's official periods of recession in the 21st Century (so far!) on the chart.
As for how to best use this data, you really want to pay close attention to how fast the growth rate of dividends per share is changing, where negative accelerations for dividends generally coincide with falling stock prices, and positive accelerations tend to coincide with rising stock prices. Also, if you compare the projected future for 2018 with what actually happened for the S&P 500's dividend growth rate, 2018 was a year that mostly lived up to early expectations.
That's not always the case, where we've seen dramatic changes in those expectations in this century, particularly when the U.S. economy fell into recession. If there's one observation that you want to take away from the chart however, it is perhaps Tadas Viskanta's observation that "recessions are a dividend killer"!
Previously on Political Calculations
Welcome to the blogosphere's toolchest! Here, unlike other blogs dedicated to analyzing current events, we create easy-to-use, simple tools to do the math related to them so you can get in on the action too! If you would like to learn more about these tools, or if you would like to contribute ideas to develop for this blog, please e-mail us at:
ironman at politicalcalculations
Thanks in advance!
Closing values for previous trading day.
This site is primarily powered by:
CSS Validation
RSS Site Feed
JavaScript
The tools on this site are built using JavaScript. If you would like to learn more, one of the best free resources on the web is available at W3Schools.com.
