Together, Texas and California are home to over one out of five teens between the ages of 16 and 19 in the United States. Of the two states, California's teen population is larger than that of Texas, although its population has been slowly declining in recent years while Texas' teen population has been growing. The following chart shows the population trends for working-age teens in both states from 2003 through 2018, where we find that Texas has grown from having three-fifths of California's teen population to nearly four-fifths.
Since we're focusing on working-age teens in both states, let's next look at teen employment levels in both states from 2003 through 2018.
In this chart, we see that California's working teen population plummeted by 40% from 2007 through 2011, before flattening out through 2014. It went on to rebound somewhat in 2015, but has stagnated at roughly 27% below its 2007 peak in all the years since.
By contrast, Texas saw a 29% decline in working teens from 2006 to 2011, but has since largely recovered. More remarkably, the number of working teens in Texas has periodically surpassed the number in California, in 2014 and again in 2017, despite having a teen population that is considerable smaller than that of California.
That's a pretty remarkable observation, so we've calculated the employment-to-population ratio for working-age teens in California and Texas from 2003 through 2018, showing the results in the next chart.
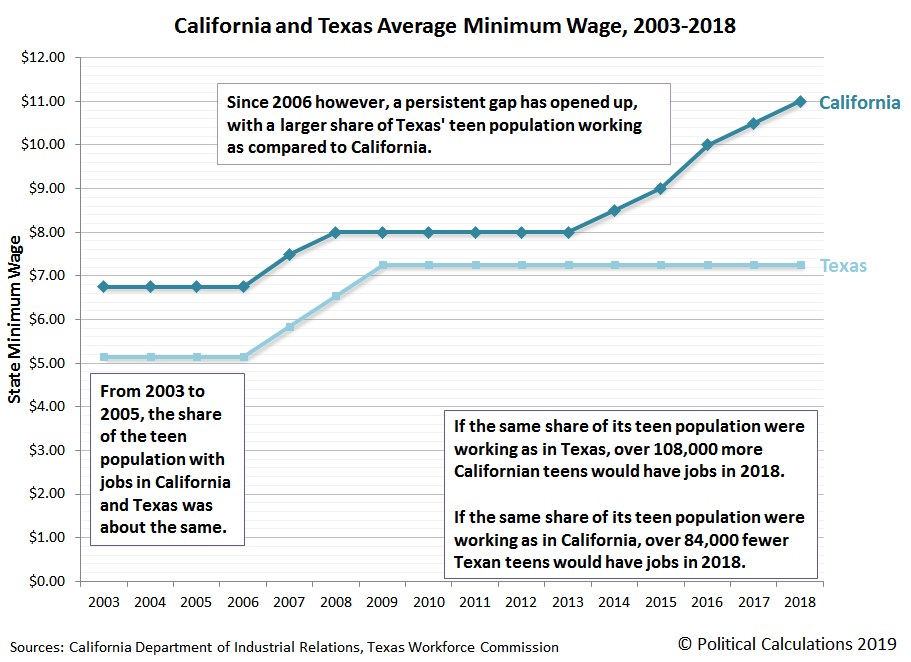
Here, we see that both states start out in a similar place, where from 2003 to 2005, the share of the teen population with jobs in California and Texas was about the same.
Since 2006 however, a persistent gap has opened up, with a larger share of Texas' teen population working as compared to California. In 2018, 28.1% of Texas' working-age teen population were earning paychecks, while only 22.7% of California's Age 16-19 population had jobs.
How big is that difference? If the same share of its teen population were working as in Texas, over 108,000 more Californian teens would have had jobs in 2018. At the same time, if the same share of its teen population were working as in California, over 84,000 fewer Texan teens would have jobs in the same year.
According to the BLS' preliminary data for 2018, California had 457,000 employed teens while Texas had 440,000.
There is, of course, one big difference between the two states that affects whether employers in each state even consider hiring teens to work for them.
That's far from the only difference between the two states however, where things like the composition of the two states' economies and the rates at which different industries in each state are growing also play a role in determining whether there are sufficient jobs that teens can land.
Teen employment is a positive factor that help boost household incomes, help the teens gain experience that will translate into higher incomes later in life, and can even reduce the amount of student loan debt that a college bound teen might otherwise have to take on. Which state's teens do you suppose are coming out ahead?
References
Bureau of Labor Statistics. Local Area Unemployment Statistics: Expanded State Employment Demographic Data. [PDF Documents: 2003, 2004, 2005, 2006, 2007, 2008, 2009, 2010, 2011, 2012, 2013, 2014, 2015, 2016, 2017, 2018 (Preliminary)]. Accessed 8 February 2019. [Note: The BLS has data that goes back to 1999, but it changed its survey methodology in 2003, making it difficult to make valid comparisons with data collected in earlier years.]
Bureau of Labor Statistics Wage and Hour Division. History of Federal Minimum Wage Rates Under the Fair Labor Standards Act, 1938-2009. [Online Article]. Accessed 8 February 2019.
State of California Department of Industrial Relations. History of California Minimum Wage. [Online Articel]. Accessed 8 February 2019.
Texas Workforce Commission. Texas Minimum Wage Law. [Online Article]. Accessed 8 February 2019.
Labels: business, economics, minimum wage
Welcome to the blogosphere's toolchest! Here, unlike other blogs dedicated to analyzing current events, we create easy-to-use, simple tools to do the math related to them so you can get in on the action too! If you would like to learn more about these tools, or if you would like to contribute ideas to develop for this blog, please e-mail us at:
ironman at politicalcalculations
Thanks in advance!
Closing values for previous trading day.
This site is primarily powered by:
CSS Validation
RSS Site Feed
JavaScript
The tools on this site are built using JavaScript. If you would like to learn more, one of the best free resources on the web is available at W3Schools.com.


