After breaking a long-running downtrend in December 2021, the question of whether that event marked a change in trend or was the result of noise in the data was raised. Housing data released by the U.S. Census Bureau last week points to noise as the answer to that question.
Combined with the latest median household income estimates, we find the raw affordability of the median new home sold in the U.S. reached an all-time low in January 2022. The following chart reveals that outcome:
Median household income only covered 17.8% of the median new home sale price in January 2022. This represents the lowest level on record for this measure of raw affordability.
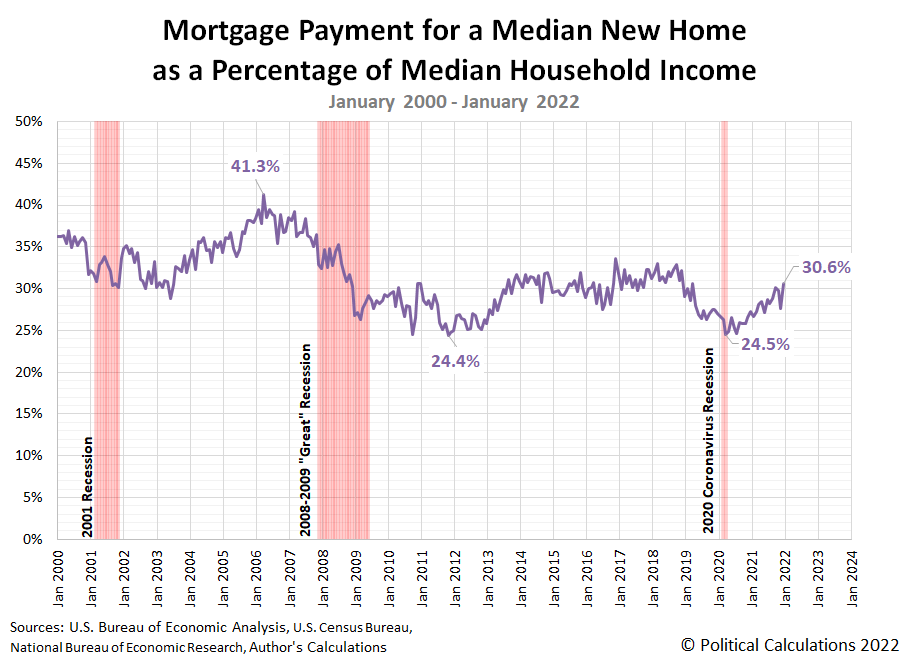
Meanwhile, mortgage rates rose to 3.45%, their highest level since the March 2020 arrival of the coronavirus pandemic in the U.S. Thanks to that development, we find January 2022 saw the resumption of the rising trend for unaffordability established since the coronavirus recession bottomed in April 2020. The next chart confirms that result:
The average mortgage payment for a median new home sold in January 2022 would consume 30.6% of the income for the median American household. What's remarkable is that we're seeing that level with 30-year conventional mortgage rates still within 1% of their all-time low of 2.68% set back in December 2020. The last time we saw the identical level of affordability was in April 2019, when mortgage rates were at 4.14%.
Exit question: Between rising mortgage rates and rising home prices, which will have the bigger effect on new home affordability?
References
U.S. Census Bureau. New Residential Sales Historical Data. Houses Sold. [Excel Spreadsheet]. Accessed 25 February 2022.
U.S. Census Bureau. New Residential Sales Historical Data. Median and Average Sale Price of Houses Sold. [Excel Spreadsheet]. Accessed 25 February 2022.
Freddie Mac. 30-Year Fixed Rate Mortgages Since 1971. [Online Database]. Accessed 25 February 2022.
Labels: inflation, median household income, real estate
Welcome to the blogosphere's toolchest! Here, unlike other blogs dedicated to analyzing current events, we create easy-to-use, simple tools to do the math related to them so you can get in on the action too! If you would like to learn more about these tools, or if you would like to contribute ideas to develop for this blog, please e-mail us at:
ironman at politicalcalculations
Thanks in advance!
Closing values for previous trading day.
This site is primarily powered by:
CSS Validation
RSS Site Feed
JavaScript
The tools on this site are built using JavaScript. If you would like to learn more, one of the best free resources on the web is available at W3Schools.com.

