The following chart shows where that probability stood with the FOMC meeting today, using the one-quarter averages of the Federal Funds Rate and spread between the 10-Year and 3-Month Treasuries as of the close of business yesterday (17 September 2007):

The change in target rate occurs as the Fed has already effectively reduced the one-quarter average of the Federal Funds Rate to 5.16%, which means that we're already well on the way the newly official target rate. With the one-quarter average of the 10-Year and 3-Month Treasury yield spread at 0.24%, our recession probability tool finds the probability of a recession occurring in the U.S. in the next 12 months is now 29.1%.
When the Fed Didn't Duck
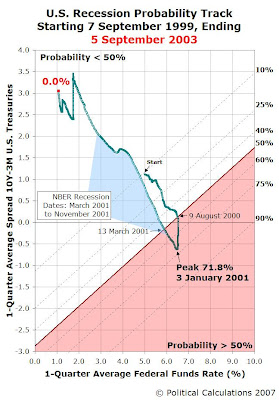
Just for fun, we thought we would revisit the recession probability tracks of the last two most recent recessions. The first chart below spans the four years from 7 September 1999 through 5 September 2003, which includes the recession that ran from March 2001 through November 2001:

In this chart, we find that the recession probability threshold breached the 50% probability threshold on 9 August 2000, roughly 7.5 months before the National Bureau of Economic Research's start date for the recession in March 2001. The probability of recession peaked at 71.8% on 3 January 2001, and dropped below the 50% threshold on 13 March 2001, about 8 months before the recession officially ended.
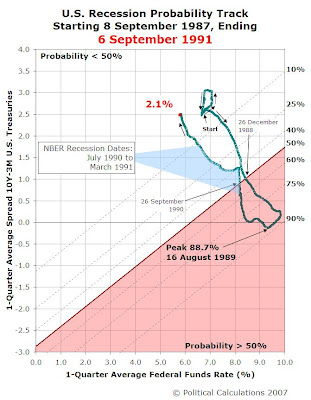
The next chart shows the recession probability track from 8 September 1987 to 6 September 1991, which includes the second most recent recession, which ran from July 1990 to March 1991:

This chart shows that in this four year timeframe, the probability of recession first broke through the 50% level on 26 December 1988 (some 16 months before the NBER's start date for the recession) and stayed well above this level until peaking at a probability of 88.7% on 16 August 1989. The probability of recession dropped below the 50% level on 26 September 1990, just five months before the official end of the recession.
This period is somewhat remarkable in that the Treasury yield curve did not invert until late-May 1989, still over a year before the NBER's official start date for this recession.
Labels: recession forecast
Welcome to the blogosphere's toolchest! Here, unlike other blogs dedicated to analyzing current events, we create easy-to-use, simple tools to do the math related to them so you can get in on the action too! If you would like to learn more about these tools, or if you would like to contribute ideas to develop for this blog, please e-mail us at:
ironman at politicalcalculations
Thanks in advance!
Closing values for previous trading day.
This site is primarily powered by:
CSS Validation
RSS Site Feed
JavaScript
The tools on this site are built using JavaScript. If you would like to learn more, one of the best free resources on the web is available at W3Schools.com.