Okay, Mr. Market, we've gotten the message: "Stop trying to predict where you're going to go when you're going through a disruptive event!"
Update 18 February 2008: The analysis below is flawed. While the analysis would be valid if we were using the correct total estimate for dividends per share for the first quarter of 2008, we erred in not incorporating the value of dividends already paid in the first quarter into our calculations, as these are not included in the dividend futures data that we did use. More details here, however we are still sticking with our non-market prediction policy!...
For those of you who may not have checked in with us yesterday, we peered into our crystal ball after seeing the dividend futures market appear to settle down and gave our best soothsayer-sayer style psychic reading that the peak of distress in the stock market was about six months away, with the market going to hit bottom then or shortly thereafter. Apparently, the dividend futures market was only resting, because it went through a whale of a move on Super Tuesday!
Here's what we mean - first, here's a chart the trailing year dividends per share for the S&P 500 since January 1988, with what the dividend futures market for the index is anticipating from now through September 2009. The dashed line is what they indicated just yesterday, while the green points are what they are indicating as of this morning:

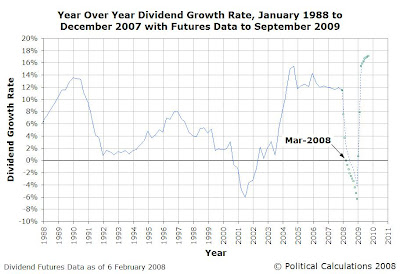
The chart above shows that the shifting bottom of that "bucket" feature we just introduced yesterday has gotten quite a bit deeper in just a day. Our next chart shows how that's affected the year-over-year rate of growth of dividends per share the futures market anticipates as of this morning for the S&P 500:

Since the dividend growth rate falls in the denominator of the price-dividend growth ratio, a rate close to zero creates the "spike" effect that we've observed that corresponds to the peak of distress in the stock market, as well as closely corresponding to bottoms in stock prices. In the chart above, we see that instead of occurring in July 2008 as we indicated yesterday, today's value would see the peak of distress in the stock market take place in March 2008, some four months earlier.
The change since yesterday in the rate of growth of dividends per share represents the biggest move since we started doing this kind of analysis. Of course, we've only been doing this kind of analysis since 15 January 2008, when it finally occurred to us to start using the data provided by the futures markets instead of using the figures that S&P had forecast back in December 2007. Since then, S&P has significantly altered their forecast for earnings, but has not yet adjusted their forecast for dividends.
As an aside, this is very much of a live process. We're inventing the analysis methods for which we're presenting results pretty much in real time, so at the very least, you can expect what we see in the future to change quite a lot!
Speaking of January 2008, we're still a couple of weeks away from updating our historical record of the S&P 500 since January 1871, The S&P 500 at Your Fingertips, for which we're waiting for the latest inflation data. As a heads up, we'll be basing our dividends information on dividend futures market data, while our earnings data will be taken from S&P's forecast. This means that you can expect that these figures will be revised in the future once we have actual data to replace the futures data.
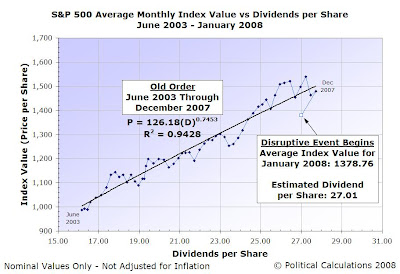
In the meantime, here's our work in progress for January 2008, in which we confirm that the old order that had existed in the stock market since June 2003 is now broken, as the market has entered into a disruptive event as of January 2008:

For our part, we're going to get out of the stock market bottom predicting business, and instead simply observe where the data goes. We figure that's probably a much more useful thing to do!
Labels: forecasting, SP 500
Welcome to the blogosphere's toolchest! Here, unlike other blogs dedicated to analyzing current events, we create easy-to-use, simple tools to do the math related to them so you can get in on the action too! If you would like to learn more about these tools, or if you would like to contribute ideas to develop for this blog, please e-mail us at:
ironman at politicalcalculations
Thanks in advance!
Closing values for previous trading day.
This site is primarily powered by:
CSS Validation
RSS Site Feed
JavaScript
The tools on this site are built using JavaScript. If you would like to learn more, one of the best free resources on the web is available at W3Schools.com.