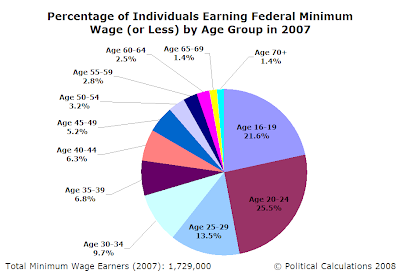
While waiting, the Economic Detective reviewed the case file, trying to work out how the gang might have pulled the caper off. From the victim autopsy, he recalled that teens weren't really the target of the hit - they were just in the way and took the blow. The real target was the source of the supply of jobs available for teens to fill, and that was the hard-working, honest and mostly mom-and-pop small business owners and operators who employ teens.

So there it is. The Public Policy Gang controls the minimum wage in the U.S. By raising the minimum wage, they could get good marks by appearing to care about low income earning people, with the most greedy and gullible mindlessly giving them their support in return for crumbs from the table, while taking massive "contributions" for themselves and their "pet" front organizations from big business and big unions, who can't stand the competition. And what better way to go after the competition than by making it too costly for them to compete?
It all fit - they had the motive and the opportunity. But the method was missing - how did they do it?
The interrogators slowly pieced together a coherent timeline from the various gang members we had rounded up. The timeline is given in the chart below, which shows the relative size of the Age 16-19, Age 20+ and the Combined number of employed individuals has changed as a percentage of their respective values from November 2006:

The Public Policy Gang had new leadership take over in November 2006. They made it clear in January 2007 that they were going to jack up the minimum wage to what they called a "living wage" level, and put enough pressure on the White House that they got them to go along with the scheme in May 2007. Employers with substantial numbers of employees who would see the mandated wage increase, knowing their costs were going to go up and not able to increase their prices to compensate because of competition, began cutting back on the number of jobs they created in step with the gang's progress toward their "living wage" goal. The employers had to if they were going to stay in business.
Teens, being disproportionately more likely to earn the minimum wage, were simply in the wrong place at the wrong time.
After May 2007, teens got a bit of a breather, but many got a nasty shock when the first increase in the mandated minimum wage took effect in the last week in July 2007. They over-reacted, letting lots of teens go in August, then brought a good number back the following month before continuing to reduce the number of employed teens at a more measured pace. By December 2007, at the peak of the expansion phase of the business cycle, the teen employment level was just 93.7% of its November 2006 value.
Teens got another break from the downward trajectory in April 2008, as the economy briefly picked up steam, but with another minimum wage hike scheduled for July 2008, it didn't last long. It wasn't until October 2008 that Dr. Doom's recession finally saw older workers take a larger share of job losses, as economic contraction took hold in the U.S. By the end of 2008, the teen employment level had dropped to 83.6% of its November 2006 value.
The Economic Detective was all set to wrap up the case, when a surprise call came in. It would seem that those 245,500 fewer employed teens in 2007, the difference between the average monthly number of those Age 16-19 counted as being employed in 2006 and 2007 during a time when the economy was still growing, were just a drop in the bucket as a gruesome discovery was made....
Labels: economics
Welcome to the blogosphere's toolchest! Here, unlike other blogs dedicated to analyzing current events, we create easy-to-use, simple tools to do the math related to them so you can get in on the action too! If you would like to learn more about these tools, or if you would like to contribute ideas to develop for this blog, please e-mail us at:
ironman at politicalcalculations
Thanks in advance!
Closing values for previous trading day.
This site is primarily powered by:
CSS Validation
RSS Site Feed
JavaScript
The tools on this site are built using JavaScript. If you would like to learn more, one of the best free resources on the web is available at W3Schools.com.