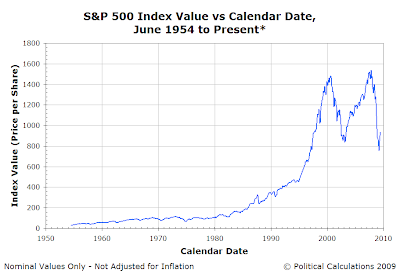
We ask these questions today since we recently went through much of the modern era of the U.S. stock market, almost decade by decade, identifying when either order prevailed in the market or when disorder ruled the behavior of stock prices. And to answer them, let's begin by first considering the chart in the upper right hand corner of this post.
Can you, just by looking at that chart, identify when stock prices were behaving predictably for periods extending from quarters to years in duration? Can you tell when it stopped?

So do you have any more insight into whether stock prices behaved in an orderly fashion during any part of the 55 years we've shown? You might, for instance, now be able to better identify the Black Friday Crash of October 1987, but can you identify when, exactly, the Dot-Com Bubble really took off?

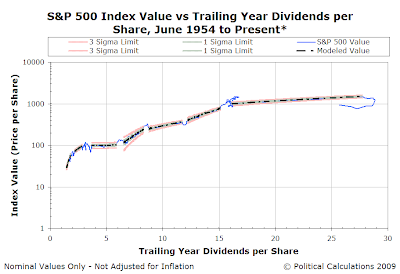
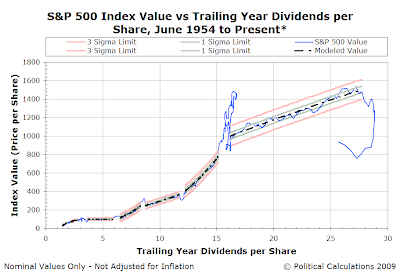
The chart to the right places control chart-style thresholds around the periods we've identified as being when stock prices would appear to have behaved as if they were in a Gaussian, or normal, distribution. Doing this, we can also identify where this kind of order doesn't apply. In doing that, we can more clearly identify periods such as the Dot-Com Bubble, which we can now see to have run from April 1997 through June 2003.

Doing that, we can see that the existence of relative order in the stock market coincides with something that stock market investors should really care a lot about: the upward movement of stock prices!

We can now easily confirm that when order has been present in the stock market, it accounts for nearly all of the sustained increase in the level of stock prices.
In fact, if we exclude the current period of disorder which began in January 2008, we find that periods of order account for 1168.76 of the gain in stock prices. Periods in which disorder reigns account for 281.5 points of the increase in stock prices from June 1954 through December 2007. If we do include the current period of disorder, we find that at present, all periods of disorder would be associated with a 260.27 point negative contribution to overall stock prices since June 1954.
If you were an investor, wouldn't it be in your best interest to know if the stock market is behaving in an orderly fashion?
Welcome to the blogosphere's toolchest! Here, unlike other blogs dedicated to analyzing current events, we create easy-to-use, simple tools to do the math related to them so you can get in on the action too! If you would like to learn more about these tools, or if you would like to contribute ideas to develop for this blog, please e-mail us at:
ironman at politicalcalculations
Thanks in advance!
Closing values for previous trading day.
This site is primarily powered by:
CSS Validation
RSS Site Feed
JavaScript
The tools on this site are built using JavaScript. If you would like to learn more, one of the best free resources on the web is available at W3Schools.com.