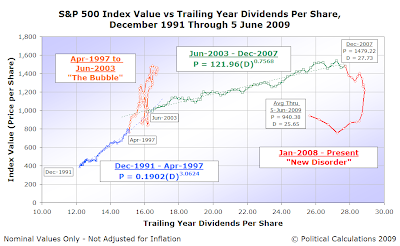
In our defense, there really wasn't much need for us to do any new forecasting since our previous forecast held up pretty well: we had forecast that the average of stock prices for the month of May 2009 would come in between 909 and 927 and the actual average of the month's daily closing values of the S&P 500 came pretty close to the low end of our forecast range at 902.41.
We'll leave it to our readers to decide how significant our missing our target by 6.6 points out of 902 might be.

In that near term, our forecasting method would anticipate that stock prices will fall in a range between 935 and 955.
So why might we be considering sending our retirement portfolio out on vacation for a couple of weeks?

To take advantage of that kind of opportunity, the way we'd want to maximize the value of our investment would be to sell it at some point during this week, while prices remain relatively high, then buy back in after prices have dropped, say on 30 June 2009, a year after a pretty strange event where the Federal Funds Rate and Treasury yield spread both acted very strangely.
In essence, we'd be betting that the percentage by which stock prices would drop would be greater than the transaction costs for first selling, then buying back into the S&P 500-type index fund in which our retirement portfolio is presently invested.
And we've got all week to decide just how lucky we feel....
Labels: forecasting, investing, recession forecast, stock market
Welcome to the blogosphere's toolchest! Here, unlike other blogs dedicated to analyzing current events, we create easy-to-use, simple tools to do the math related to them so you can get in on the action too! If you would like to learn more about these tools, or if you would like to contribute ideas to develop for this blog, please e-mail us at:
ironman at politicalcalculations
Thanks in advance!
Closing values for previous trading day.
This site is primarily powered by:
CSS Validation
RSS Site Feed
JavaScript
The tools on this site are built using JavaScript. If you would like to learn more, one of the best free resources on the web is available at W3Schools.com.