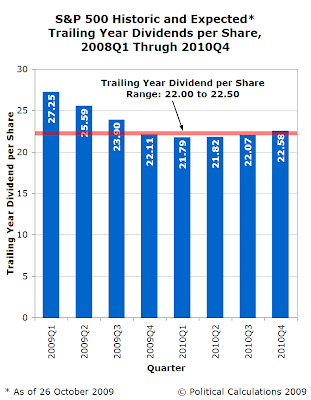
 Understanding how the stock market's dividends are changing is key to understanding what investors are expecting in the future of the market. Today, we're going to look at four snapshots in time, which correspond to different points in time of the now 60% rally in stock prices that has taken place since the market bottomed earlier this year.


What we find interesting here is that stock prices had risen over 32% from their bottom at this point in time, even as the expected level of dividends per share eroded without suggesting stronger growth in the future. What that observation tells us is that much of the market rally through this point in time was based on the expectation by investors that the situation of publicly traded companies was becoming "less bad."
These two observations contradict what many market and economic analysts have indicated they believe lies behind the stock market rally we've observed in 2009: the hypothetical expectation by investors of a "V-shaped" economic recovery. In our view, this hypothesis has become something of a "straw man" argument, one made specifically for the purpose of knocking it down to make the analyst appear more credible.


But here, we see a significant reversal from the trend we've seen throughout the market rally. Each quarter going forward from that point is both higher than where it was forecast on 3 August 2009, but also progressively higher in two of the three following quarters. What this observation suggests is that investors are now expecting a real recovery for the publicly traded companies of the stock market.
How real is that suggestion of a recovery though? We've dug into the data behind the dividend futures data and found two significant changes that have altered investors' view of the future for the stock market.
First, on 12 October 2009, JP Morgan Chase (NYSE: JPM) announced that they would be very likely to substantially increase their dividends in 2010. This announcement is significant in that the bank had previously slashed their dividend by 87% to just five cents per share as requirement imposed by the government for having received funding from the Troubled Asset Relief Program (TARP) in October 2008.
At the time, the slashing of the company's dividend help contribute to the market crash in October 2008, so the resumption of the company's dividends at higher levels would indeed indicate a recovery, although perhaps an artificial one. By that, we're referring to the role of the government in mandating all TARP recipients cut their dividends to no more than five cents per share, regardless of their financial health. Since JP Morgan Chase was considered to be a healthy company at the time it cut its dividends, so its resumption of paying higher dividends doesn't necessarily indicate that economic conditions are improving substantially.
That brings us to today, where once again dividend futures have leapt in value over the past weekend, as Freeport-McMoRan Copper and Gold (NYSE: FCX) announced that it will resume paying its dividend. The mining and raw material producing company had previously suspended its dividend payments in early December 2008 as the world economic situation was worsening at the time.
Between the two dividend announcements, the Freeport-McMoRan is more significant in that it is not influenced by the U.S. government's intervention into the market, which indicates that the economic situation is indeed improving.
What we have then from our observation of how stock market dividends are changing is a mixed-to-slightly favorable impression that an economic recovery is indeed taking place. What we'd like to see is more publicly-traded companies in industries where the government hasn't co-opted basic business decisions follow suit in boosting their dividends, which would confirm that the apparent recovery has strength.
In the interest of disclosure, Ironman holds no positions in either JP Morgan Chase or Freeport-McMoRan.
Labels: economics, forecasting, stock market
Welcome to the blogosphere's toolchest! Here, unlike other blogs dedicated to analyzing current events, we create easy-to-use, simple tools to do the math related to them so you can get in on the action too! If you would like to learn more about these tools, or if you would like to contribute ideas to develop for this blog, please e-mail us at:
ironman at politicalcalculations
Thanks in advance!
Closing values for previous trading day.
This site is primarily powered by:
CSS Validation
RSS Site Feed
JavaScript
The tools on this site are built using JavaScript. If you would like to learn more, one of the best free resources on the web is available at W3Schools.com.