Between the months of November and December of 2009, 589,000 jobs disappeared from the U.S. economy.
Of these jobs, 47,000 (8.0% of the total 589,000) were lost by teens, who now represent just 3.20% of the entire U.S. civilian labor force of 137,792,000 individuals. 57,000 jobs (9.7%) were lost by young adults Age 20-24, who as a group make up 9.0% of the U.S. workforce, while the remaining 485,000 were lost by Americans Age 25 and higher.

Meanwhile, older Americans have seen 5,580,000 jobs disappear over the same time frame.
With the latest employment numbers released in January 2009, the Bureau of Labor Statistics has revised its employment figures going back several years. We're taking the opportunity to update a number of our employment charts showing how teens and young adults have fared in the economy of recent years.

Here, we see that the relative percentage of teens in the U.S. workforce has declined steadily from the average value of 4.24% observed between January 2005 and December 2006, with small differences from the values previously reported by the BLS. We see that the percentage representation of teens peaked at a high value of 4.31% of the workforce in June 2006 and last peaked above the average level at 4.29% of the total U.S. workforce in November 2007.

Moreover, we confirm that changes in teen employment levels in 2007 remain well correlated with the legislative process that led to the passage of higher minimum wages in the United States. We observe that teen employment levels were declining for a year prior to the beginning of recession in the U.S., despite robust economic growth throughout 2007.
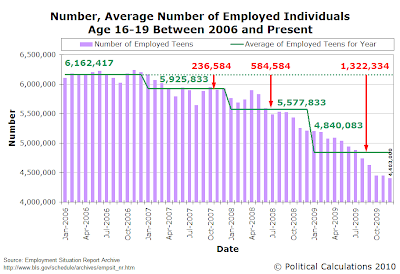
As of December 2009, we find that compared to when teen jobs peaked in November 2006, the number of teen jobs has declined by 29.5%, with nearly 3 out of every 10 teen jobs that existed three years ago no longer in existence.

Looking at the monthly number of employed, we see that after reacting to the minimum wage increases of 2007, teen employment levels were largely steady at a lower level until April 2008. the period of April 2008 through October 2008 saw a sharp decline in the number of employed U.S. teenagers, as it coincided with a period of record high oil prices in the U.S.
American consumers reacted to the spike in oil prices by reducing their retail spending to compensate. With such a large portion of teens are employed in the retail sectors of the U.S. economy, it makes sense that their employers would act to remove a large number of teens from their payrolls to compensate for the reduction in consumer demand.
Teen employment then stabilized from October 2008 through February 2009, as the greatest period of distress occurred in the U.S. banking and financial sectors and the U.S. automotive sector, as we might expect since so few teens work in these industries.
At the end of February 2009, the so-called "economic stimulus" bill advanced by President Obama was passed into law by the action of his majority political party in Congress. We see the reaction of employers since has been largely to reduce the number of teens on their payrolls, beginning almost immediately in March 2009. Teen employment rose slightly in April 2009, then began falling at the fastest rates of the entire period of teen job loss through October 2009.
Teen employment levels, while lower than October 2009, may be beginning to stabilize. We'll need several more months of data to confirm if that's the case.
The Obama administration would appear to finally be reacting to the declining employment situation in the United States and the near-complete failure of its vaunted "economic stimulus" package to improve it:
A top White House economic adviser said Sunday "you'll get no argument from" her on the need to improve the miserable jobs picture.
Council of Economic Advisers chief Christina Romer said it's devastating that some workers have been unemployed for two years and that job losses were continuing nearly a year after passage of the so-called stimulus bill.
[...]"The sense that we need to do more is overwhelming," she said.
By "more," Romer is referring to additional "targeted" economic stimulus measures, such as the proposed "Cash for Caulkers" program and extended COBRA health insurance subsidies for the unemployed who elect to continue their employer-provided coverage, who would otherwise have to pay the full cost of the health insurance to do so.
We can't make this stuff up.
Labels: economics, jobs, minimum wage
Welcome to the blogosphere's toolchest! Here, unlike other blogs dedicated to analyzing current events, we create easy-to-use, simple tools to do the math related to them so you can get in on the action too! If you would like to learn more about these tools, or if you would like to contribute ideas to develop for this blog, please e-mail us at:
ironman at politicalcalculations
Thanks in advance!
Closing values for previous trading day.
This site is primarily powered by:
CSS Validation
RSS Site Feed
JavaScript
The tools on this site are built using JavaScript. If you would like to learn more, one of the best free resources on the web is available at W3Schools.com.