Political Calculations
December 23, 2009

At the beginning of December 2009, we recognized that investors had effectively reached the edge of the chart in navigating the U.S. stock market. They had first reached the edge in October 2009, as they looked forward from that month to the fourth quarter of 2010 to set the value of stock prices with respect to the level of the S&P 500's dividend futures expected in 2010Q4.

The fourth quarter of 2010 marked the edge of the known world where the available dividend futures for U.S. stock markets at that time and, at this writing, it still does as dividend futures contracts extending into 2011 have yet to be opened. These futures contracts should be opened sometime in the first quarter of 2010.

Here is what we observed at the time, as we recognized that investors were entering uncharted waters:

But we have a problem, and that problem is that we strongly suspect we've run over the edge of our chart. Here's exactly what we're looking at on 1 December 2009 as we consider our forecast:

Accelerations of S&P 500 Average Monthly Index Value and Trailing Year Dividends per Share (and Futures), as of 1 December 2009

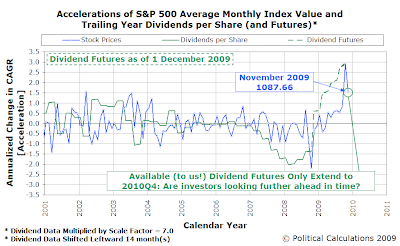
There are two potential explanations for what we observe. The first is that investors have perhaps focused their attention upon the second quarter of 2010 instead of the fourth quarter, as we see that the level of the amplified change in the growth rate of dividends per share would seem to correlate reasonably well with the change in the rate of growth of stock prices we observed for November 2009.

That would make sense if there were some news affecting the expected future level of dividends per share to be paid in that quarter. However, we're unaware of any such news and in its absence, we think that to be unlikely.

The other potential explanation for what we see happening is that investors are looking past where they expect the S&P 500's dividends per share will be in 2010Q4 to the first quarter of 2011 instead, as determined by the dividend futures contract that applies for each quarter. That would make sense since the 2011Q1 contract would correspond to the period of time that includes the end of 2010, as the 2010Q4 futures contract only extends to 17 December 2010. That focus would also agree with much of what we observed during this year, with investors primarily focused from May through October upon the dividend futures contract for 2010Q1.

Today, we can confirm that both these potential explanations have elements that are both right and wrong. As we'll show you next, investors have indeed shifted their focus from where they expect the S&P 500's dividends per share will be in the fourth quarter of 2010 in setting the value of today's stock prices, but not to either where they expect they will be in the second quarter of 2010 or in the first quarter of 2011.

They've instead set them with respect to where they expect the S&P 500's trailing year dividends per share will be in the first quarter of 2010, just as they have throughout most of 2009!

Accelerations of S&P 500 Average Monthly Index Value and Trailing Year Dividends per Share (and Futures), as of 23 December 2009

In effect, stock market investors in the U.S. have returned to safer harbors. What we observe now is that the change in the rate of growth of stock prices in November 2009 was simply a transition between the two future points of investor focus.

With this knowledge, we can now revise our forecast for where the average of stock prices will be for the month of December 2009. Amplifying the value of the expected change in the growth rate of the S&P 500's trailing year dividends per share by scale factors of 6.5 to 11.0, which we've previously observed to be typical range for the U.S. stock market since January 2001, we project that the average of the S&P 500's closing daily index value for December 2009 will fall between 1101 and 1115, which is indicated as the converging orange region in the chart below. This marks an upward revision from the top end of our previous forecast range of 1032-1094, which is indicated by the dashed lines.

S&P 500 Average Monthly Index Value, 
January 2008 to Present, 23 December 2009

Having recorded an average value of 1105 through 22 December 2009, we find it very likely that stock prices will fall into our revised target range for the month.

Assuming that the average value of the S&P 500 index will end the month with the same average value of 1105 and that investors remain focused on 2010Q1, we would project that stock prices in January 2010 will fall between 1110 and 1123, provided there are no major changes in 2010Q1's expected dividend payouts.

And with that prediction based upon still incomplete data, we'll sign off for the year. Have a Merry Christmas and Happy New Year!

Labels: , , ,


<< Home
Unexpectedly Intriguing!

About Political Calculations


blog advertising
is good for you

Welcome to the blogosphere's toolchest! Here, unlike other blogs dedicated to analyzing current events, we create easy-to-use, simple tools to do the math related to them so you can get in on the action too! If you would like to learn more about these tools, or if you would like to contribute ideas to develop for this blog, please e-mail us at:

ironman at politicalcalculations.com

Thanks in advance!

Recent Posts

Geek Logik: There's an App for That!

Peering Into 2010

On the Moneyed Midways - December 18, 2009

November 2009's Teen Employment Snapshots

Just a Touch of Chaos on a Tuesday

Can You Squeeze Your Car Into That Space?

On the Moneyed Midways - December 11, 2009

The Trigger Point for Taxes

Dueling Futures

Hauser's Law

Elsewhere on the Web

This year, we'll be experimenting with a number of apps to bring more of a current events focus to Political Calculations - we're test driving the app(s) below!

Most Popular Posts

The S&P 500 at Your Fingertips

The Distribution of Income for 2010: Individuals

Should You Trade in Your Gas Guzzler?

What Are the Chances Your Marriage Will Last?

Tipping Around the World

What's Your Body Fat Percentage?

The Odds of Dying, Again!

Gas Prices, the Unemployment Rate, and Desperation

Hauser's Law

The Real Story Behind "Rising" U.S. Income Inequality

Quick Index

First Time Visitor to Political Calculations?

On the Moneyed Midways

A Lot, But Not All, of Our Tools

U.S. GDP Temperature Gauge

Political Calculations' GDP Temperature Gauge, 2013Q1 First Estimate Political Calculations' U.S. GDP Temperature Gauge provides a means to quickly evaluate the growth rate of the U.S. economy against the backdrop of how the economy has performed since 1980, with the "temperature" color spectrum ranging from a recessionary "cold" (purple) through an expansionary "hot" (red).

The GDP Temperature Gauge presents both the annualized GDP growth rate as reported by the U.S. Bureau of Economic Analysis reports for a one-quarter period and also as averaged over a two quarter period, which smooths out the volatility seen in the one-quarter data and provides a better indication of the relative strength of the U.S. economy over time.

Site Data

This site is primarily powered by:

This page is powered by Blogger. Isn't yours?

Visitors since December 6, 2004:

CSS Validation

Valid CSS!

RSS Site Feed

AddThis Feed Button

JavaScript

The tools on this site are built using JavaScript. If you would like to learn more, one of the best free resources on the web is available at W3Schools.com.

Other Cool Resources

ZunZun - Exceptional regression analysis tool.
Wolfram Integrator - Solve integrals. Do calculus!
Create a Graph - Easy-to-use basic graph-making tool.
Many Eyes - Data visualization extraordinaire!
Wolfram Alpha - Computational knowledge engine.
Khan Academy - Math & science video mini-lectures!
Picasion - Animate images.


Archives
December 2004
January 2005
February 2005
March 2005
April 2005
May 2005
June 2005
July 2005
August 2005
September 2005
October 2005
November 2005
December 2005
January 2006
February 2006
March 2006
April 2006
May 2006
June 2006
July 2006
August 2006
September 2006
October 2006
November 2006
December 2006
January 2007
February 2007
March 2007
April 2007
May 2007
June 2007
July 2007
August 2007
September 2007
October 2007
November 2007
December 2007
January 2008
February 2008
March 2008
April 2008
May 2008
June 2008
July 2008
August 2008
September 2008
October 2008
November 2008
December 2008
January 2009
February 2009
March 2009
April 2009
May 2009
June 2009
July 2009
August 2009
September 2009
October 2009
November 2009
December 2009
January 2010
February 2010
March 2010
April 2010
May 2010
June 2010
July 2010
August 2010
September 2010
October 2010
November 2010
December 2010
January 2011
February 2011
March 2011
April 2011
May 2011
June 2011
July 2011
August 2011
September 2011
October 2011
November 2011
December 2011
January 2012
February 2012
March 2012
April 2012
May 2012
June 2012
July 2012
August 2012
September 2012
October 2012
November 2012
December 2012
January 2013
February 2013
March 2013
April 2013
May 2013

Blog Roll

Bloodhoundblog
Budgets Are Sexy
Cafe Hayek
Carpe Diem
Core77
Coyote Blog
Craig Harper
Darwin's Finance
Digerati Life, The
Division of Labour
Dough Roller, The
Eclectecon
Econlog
Economics Roundtable
EconomicsUK
Environmental Economics
Escape from Cubicle Nation
Execupundit
FiscalGeek
Get Rich Slowly
Gongol
Good Financial Cents
HR Bartender
Hot Air
i4cp Productivity
Innocent Bystanders
Innovation and Growth
Instapundit
Intangible Economy
I've Paid Twice for This Already
Joanne Jacobs
Kaus Files
Len Penzo dot Com
Making Ripples
Market Power
Mechonomics
Mighty Bargain Hunter
Monevator
My Dollar Plan
New Economist
Newmark's Door
Nina Simosko
Physorg
Private Sector Development
Real Clear Politics
Richard Fernandez
Roger L. Simon
Rowan Manahan
Sound Politics
SOX First
Sports Economist, The
squawkfox
Three Star Leadership
Tim Worstall
Townhall
Trusted Advisor
Uncommon Misperceptions
voluntaryXchange
WILLisms
Winterspeak

Market Links

Big Picture, The
Crackerjack Finance
CXO Advisory Group
Disciplined Approach to Investing
Dividend Guy, The
Doug Short
Evidence Investing
Fat Pitch Financials
FX Investment Strategies
Oilprice

Charities We Support

American Red Cross
Children's Heart Foundation
Salvation Army
SMA Foundation

Recommended Reading

Kindle Paperwhite 3G - Best e-reader!
Angel in the Whirlwind
Bailout Nation
Cartoon Guide to Statistics
A Comprehensive Guide to the Peloponnesian War
The Complete Personal Memoirs of Ulysses S. Grant
The Count of Monte Cristo
Ender's Game
Gardner's Art Through the Ages
Empire of Wealth
How to Make Presentations to Councils and Boards
Juran's Quality Handbook
Marks' Standard Handbook
The Second World War
Stocks for the Long Run
Why Smart Executives Fail

Recommended Viewing

The Tudors: The Complete Series

Recently Shopped

Kindle Fire HD 8.9" 4G LTE Wireless 32 GB
Snap Circuits Jr. SC-100
Nerf Vortex Praxis
Sony BRAVIA 40" LED HDTV
2540 Series Docking Station
New Balance MX623
Dunham Men's Waterproof Oxford
TN360 Black Toner Cartridge
The Dangerous Book for Boys
Air Swimmer Remote Control Inflatable Flying Shark
Fisher-Price Little People Lil Pirate Ship

Seeking Alpha Certified