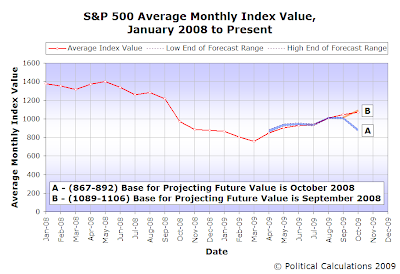
Not bad, eh? To be honest, we missed to the low side for Option B, with the average for the S&P 500 coming in at 1067.66, an error of roughly 2.0%. As a result, we'll be scoring two misses in our unforgiving plus-minus score for predictions, but as always, we'll leave it up to you to determine how meaningful our misses are.
But that's not the bit where we blow the doors off your mind. That's going to require a different chart.

We can visually verify that investor focus upon this period by considering the track taken by the change in the rate of growth of stock prices with respect to the level of that for dividends per share. What we see is that the acceleration for stock prices has traced a largely horizontal path, which has been largely consistent with the level of the acceleration for trailing year dividends per share corresponding to the dividend futures contract for 2010Q1.
Looking at that chart however, we also see something that demands a question be answered. There's a massive surge in the change in the rate of growth for trailing year dividends per share for the quarters following 2010Q1. When might that surge factor into where the average level of stock prices during the course of a month is set?

Here, we find that the average level of stock prices for the month of October 2009 falls between the amplified level of acceleration of where the dividend futures contracts for 2010Q3 and 2010Q4 would place them.
Now the question is which one of these quarters is providing the fundamental support behind stock prices today? Unfortunately, we don't know the answer to that question as yet.

Incorporating the typical span of amplification factors that we have observed since January 2001, which ranges from 6.5 through 11.0, our math would anticipate stock prices for November 2009 to range between 936 and 1074, which encompasses the full overlapping range for both future quarters for dividends. For the sake of narrowing that range down, if we consider amplification factors between 9.0 and 11.0, that range becomes 1004 to 1074. This latter range is indicated in our forecast chart for November 2009.
It should be an interesting month. The larger values for the rate of dividend acceleration that would seem to apply provide for a wider forecast range (when multiplied by our typical amplification factors.) That provides a lot wider window into which stock prices might be expected to fall - on top of our overlapping forecast range.
Labels: chaos, forecasting, SP 500
Welcome to the blogosphere's toolchest! Here, unlike other blogs dedicated to analyzing current events, we create easy-to-use, simple tools to do the math related to them so you can get in on the action too! If you would like to learn more about these tools, or if you would like to contribute ideas to develop for this blog, please e-mail us at:
ironman at politicalcalculations
Thanks in advance!
Closing values for previous trading day.
This site is primarily powered by:
CSS Validation
RSS Site Feed
JavaScript
The tools on this site are built using JavaScript. If you would like to learn more, one of the best free resources on the web is available at W3Schools.com.