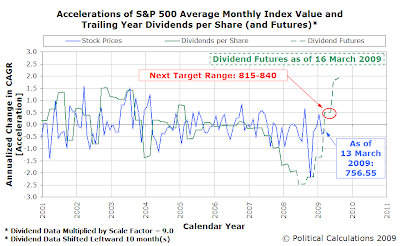
 When we last looked at where stock prices were heading, back on 3 March 2009, we anticipated that the S&P 500 would drop to a range between 655 and 680. They arrived at that range just three days later, with the S&P hitting a low value of 666.79 and closing at a level of 683.38 that day. The next trading day, 9 March 2009, saw the S&P 500 close within our target range at a level of 676.55.
But really, when we forecast a target range for the S&P 500, we have no idea when it's going to get there. Alternatively, when we forecast when a market bottom might occur, we have no idea at what level the bottom will be. Sadly, that's just the nature of the kind of forecasting that we can do. As we've previously observed:
As a practical matter, our experience to date (and remember, we've only been doing this since December 2008) is that you can work out either how much things will change, or perhaps when they will, but not necessarily both simultaneously.
As we've been demonstrating, and despite White House economic advisor's Larry Summers exceptionally ill-informed "Irrational Pessimism" speech to the contrary, investors have been behaving in an exceptionally rational fashion in setting the level of stock prices. As the outlook for the expected future growth of corporate dividend per share payments declined throughout the first quarter, we find that investors have adjusted the level of stock prices in direct proportion to those expectations.
And that's no different today, with stock prices rebounding strongly after reaching the bottom we had forecast, although later than we had hoped (but still well within the window of time in which we anticipated a market bottom occurring.) So why are stock prices headed upward and where might they go next?

The timing of this upward move isn’t an accident. With the imminent closing of the first quarter of 2009, most companies anticipating a worse-than-previously expected year have taken action to reduce their dividends, which removes a considerable amount of negative uncertainty potential from the market. Likewise, the end of the quarter means that a new dividend futures contract has opened, which when combined with the positive statements from the banking and financial sector of the economy in the past week, is in part responsible for the more forward-looking shift in investor focus that we've long been anticipating.
Barring any change in the outlook for the future growth rate of dividends that would require us to alter our forecast, with this forward shift in investor focus, we would anticipate that stock prices will rise to a range between 815 and 840, given the typical levels of the amplification factor that we've observed in the stock market since 2001.
Just don't ask us when exactly it will get there. We don't know! (See the fourth update below!)
Update 18 March 2009: The growth rate of dividends dipped a bit, but not much. Look for upward growth to continue toward the lower end of our target range, then stall out until the next shift in investor time frame focus or significant change in the outlook for dividend growth (a currently unexpected dividend increase or cut.)
Update 18 March 2009: (A little bit later in the day!) Hello, Oracle! Maybe we can go back to that original range - we'll see once the futures market incorporates the S&P 500's #24 company by market capitalization newly announced nickel-per-share quarterly dividend!
Update 23 March 2009: Okay, we hit our target range just seven days after we announced it!
Labels: chaos, dividends, forecasting, SP 500, stock market
Welcome to the blogosphere's toolchest! Here, unlike other blogs dedicated to analyzing current events, we create easy-to-use, simple tools to do the math related to them so you can get in on the action too! If you would like to learn more about these tools, or if you would like to contribute ideas to develop for this blog, please e-mail us at:
ironman at politicalcalculations
Thanks in advance!
Closing values for previous trading day.
This site is primarily powered by:
CSS Validation
RSS Site Feed
JavaScript
The tools on this site are built using JavaScript. If you would like to learn more, one of the best free resources on the web is available at W3Schools.com.