"Hello?" mumbled the investigator.
"It's Doc," the voice said. "You wanted to know when the numbers for 2008 came out," rasped the voice on the other end of the line. "They're out. Now."
"I'll get on it," said the Economic Detective, as the line clicked to disconnect.
It had been a while since the Economic Detective had closed the books on the case of what killed so many jobs for teens in 2007. He'd found that the Public Policy Gang was behind the massive teen job kill, but more than that, their fingerprints were all over the disappearance of nearly one million jobs from the U.S. economy that year.
But they were still out there. Still sticking their power-hungry hands into every place where they thought they might get even more for themselves, no matter the cost to anyone else. How many teen jobs might have gotten whacked in 2008 because of their schemes? That's why the Economic Detective now rose out of bed to go to work, because the Data Jocks at the BLS had finally accounted for all the minimum wage jobs in the U.S. for that year.
In 2008, the federal minimum wage had been increased from $5.85 per hour to $6.55 per hour on 24 July 2008. By all rights, that should increase the number of people counted as earning the federal minimum wage or less, since that would sweep up all the people who had been earning more than the old minimum wage but less than the new one.
That had certainly been the case between 2006 and 2007, when the number of people identified by the BLS' data jocks as earning the federal minimum wage or less had increased from 1,692,000 in 2006, when the minimum wage was set at $5.15 per hour, to 1,729,000 in 2007, when the minimum wage was increased to $5.85 per hour.

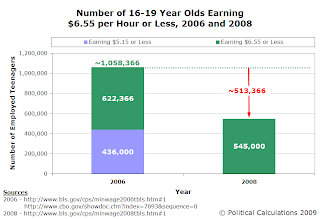
In 2008, teens accounted for 545,000 of the 2,226,000 minimum wage earning jobs, or 24.5% Meanwhile, young adults between the ages of 20 and 24 held 577,000 of these jobs, or 25.9%. Together, these two age groups account for just over half, or 50.4%, of all the jobs in the U.S. that earn the federal minimum wage of $6.55 or less.

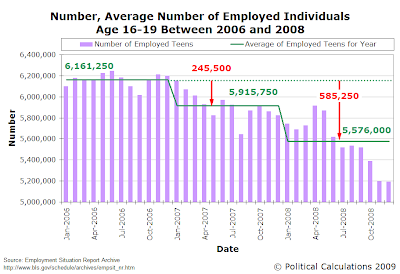
513,366 minimum wage jobs for teens is a lot to disappear over a two year period for a group that's dropped from 4.3% of the U.S. workforce to just 3.6% today. The Economic Detective wondered how many of the jobs for teens that disappeared betwene 2006 and 2008 might be accounted for by the disappearance of jobs paying the federal minimum wage of $6.55 per hour. The following chart gives the change in the average number of teens for each year from 2006 through 2008:

Here, we see that the number of employed teens dropped from an average monthly level of 6,161,250 in 2006 to an average monthly level of 5,576,000 for 2008, a decrease of some 585,250. With the decrease in the number of jobs paying teens $6.55 or less of 513,366 over the same time, that means that the disappearance of minimum wage jobs for teens accounts for 87.7% of the entire job loss for teens between these two years.
"At least," mused the Economic Detective, "the kids at the very bottom of the U.S. workforce aren't completely alone in taking the brunt of job losses in the U.S. anymore. Misery certainly loves company...."
The phone rang again. "The numbers are looking pretty brutal," said Doc. "There's so many more kids out there who aren't getting that entry level work experience that'll pay off for them as they get older. Not to mention the reality check on life that comes with that first job.
"But did you ever wonder what happens to the people at the places where these jobs aren't anymore? The ones left behind but still working? Think about that for a while." And once more, Doc hung up on the Economic Detective.
"Great," said the Economic Detective to the man on the phone who wasn't there anymore, before putting any more thinking on hold for the night and going back to bed.
Previously on Political Calculations
The Economic Detective series actually began as a fun way for us to revisit and re-create a lot of data and analysis we had done, but lost nearly a year ago. Here is the ongoing saga as it stands today:
- Natural Causes, or Not?: The BLS revised employment data going back to 2004, which provided the launch point for the Economic Detective, who discovered that "something broke" for teens seeking jobs between 2006 and 2007.
- Victim Autopsy: You can't have a good mystery unless you've got a corpse to analyze. Or a lot of corpses to analyze.
- Lining Up the Suspects: The potential culprits behind the crime are introduced and interrogated.
- Prime Suspect Revealed: Suspects are eliminated and the Economic Detective homes in on the guilty party.
- A Final, Gruesome Discovery: The case threatens to blow up and the crime gets much, much larger.
- A Late Night Call: The Economic Detective, and the case, is re-awakened as the teen job killing spree continues into 2008.
Labels: economics, minimum wage
Welcome to the blogosphere's toolchest! Here, unlike other blogs dedicated to analyzing current events, we create easy-to-use, simple tools to do the math related to them so you can get in on the action too! If you would like to learn more about these tools, or if you would like to contribute ideas to develop for this blog, please e-mail us at:
ironman at politicalcalculations
Thanks in advance!
Closing values for previous trading day.
This site is primarily powered by:
CSS Validation
RSS Site Feed
JavaScript
The tools on this site are built using JavaScript. If you would like to learn more, one of the best free resources on the web is available at W3Schools.com.