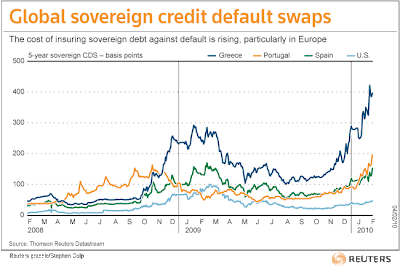
 Which European Union nations do investors in Credit Default Swap (CDS) contracts believe are most at risk of defaulting on their national debt payments? And how do various U.S. states rank in comparison to those EU-15 nations?
Before going any further, since we haven't covered the topic previously, let's take a moment to discuss just what a Credit Default Swap is! Going by David Van Knapp's handy glossary for today's economic crisis, a credit default swap is "a contract between 'counterparties' that, in effect, insures against defaults in financial instruments. The buyer makes periodic payments to the seller, and in return receives a payoff if the underlying investment instrument defaults."
While Van Knapp has it in quotation marks, "counterparties" simply refers to the direct participants in the transaction - the buyer(s) and seller(s) of these contracts, who may be either individuals or institutions.
If you're not one of the counterparties involved in these kinds of contracts, the main value of these financial instruments is what they communicate by their spread. Here, the spread is the premium the buyer of the CDS contract pays the seller in order to be protected against the risk of a default taking place on the debt against which the contract is being written. The amount of the spread is proportionate to the perceived risk - if the underlying debt against which the CDS is being written is at a high risk of default, its spread will be much higher than that for a CDS contract written against against debt that is at a low risk of seeing the borrower discontinue making full payments on their debt.
CDS spreads are measured in basis points (bps). If a CDS spread is 500 bps, then the buyer of the CDS contract paying a 5% premium to insure the debt. Or as Vince Veneziani describes it, "if you have $1 million in debt, you can insure it for $50,000."
We should note that CDS spreads can be very volatile, changing a great deal over very short periods of time.
Having covered that basic territory, let's take a closer look at the CDS spreads that apply for the EU-15 and the U.S. states with the highest CDS spreads, both back in March 2010 and again in May 2010. The comparisons aren't quite perfect, since the snapshots in time for the data between the U.S. and E.U. were taken at different times, however we'll assume the relative levels between U.S. states and E.U. nations are in the right ballparks. You can click the column headings to sort the data from either high to low (or vice-versa by clicking a second time).
| EU vs US Credit Default Swap Sovereign Debt Default Risk, March 2010 vs May 2010 |
|---|
| EU Nation or US State | CDS Spread (March 2010) | CDS Spread (May 2010) |
|---|---|---|
| Austria | 55.1 | 73.8 |
| Belgium | 54.4 | 95.5 |
| Denmark | 34.0 | 46.2 |
| Finland | 32.9 | 40.4 |
| France | 45.8 | 70.8 |
| Germany | 33.0 | 49.8 |
| Greece | 316.3 | 712.3 |
| Ireland | 139.5 | 216.5 |
| Italy | 109.9 | 174.7 |
| Netherlands | 34.0 | 46.4 |
| Portugal | 136.5 | 352.8 |
| Spain | 113.3 | 208.9 |
| Sweden | 34.7 | 41.8 |
| United Kingdom | 74.5 | 79.6 |
| California | 301.4 | 170.9 |
| Illinois | 233.6 | 217.8 |
| Massachusetts | 120.8 | 77.1 |
| Michigan | 211.3 | 166.7 |
| Nevada | 190.8 | 131.1 |
| New Jersey | 222.2 | 142.5 |
| New York | 224.2 | 147.3 |
| New York City | 211.7 | 147.3 |
What we find is that things in Europe became very bad from March to May, coinciding with the Greek debt crisis - they appear to have moderated somewhat since for many nations, but CDS spreads remain elevated for countries like Spain and Portugal. Meanwhile things improved in the U.S. states between March 2010 and May 2010, as many states began enacting austerity measures to bring their levels of spending into better alignment with their tax collections. Illinois, at this point in time, stands out for not yet having taken any effective action.
Where the Data Came From
- US CDS Spreads, March 2010: Vince Veneziani and Gregory White, Business Insider, 10 Debt-Laden States Quickly Becoming The Next California. 2 March 2010.
- US CDS Spreads, May 2010: Gus Lubin, Business Insider, The 10 States Most Likely To Default. 20 May 2010.
- EU-15 CDS Spreads: Standard & Poor, Credit Market Commentary: Contagion Fears Push EU CDS Spreads Wider. 6 May 2010.
Labels: economics, national debt
Welcome to the blogosphere's toolchest! Here, unlike other blogs dedicated to analyzing current events, we create easy-to-use, simple tools to do the math related to them so you can get in on the action too! If you would like to learn more about these tools, or if you would like to contribute ideas to develop for this blog, please e-mail us at:
ironman at politicalcalculations
Thanks in advance!
Closing values for previous trading day.
This site is primarily powered by:
CSS Validation
RSS Site Feed
JavaScript
The tools on this site are built using JavaScript. If you would like to learn more, one of the best free resources on the web is available at W3Schools.com.