 We follow the teen jobs scene for one major reason: teens are the most marginal of workers in the U.S. economy. By that, we mean that compared to all older workers, teens are the least educated, least skilled and the most inexperienced members of the U.S. workforce. And unlike older workers, teens can easily disappear from the U.S. workforce, as they often have the option of being full time students while living in their parents' home if their employment prospects aren't good.
Being the most marginal members of the U.S. workforce then, teens are the first in line to be affected by any good or bad developments in the U.S. job market. So much so that what happens in the job market for teens can be taken as a leading indicator for what will happen about a year later in the U.S. economy.
Which brings us to the Bureau of Labor Statistics' June 2010 Employment Situation report, which suggests that things will be taking a rather dramatic turn for the worst in the latter half of 2011. The charts below show what we found when we dug into the report to uncover the teen job situation.

That in itself isn't a big deal, as we do expect some volatility in the jobs numbers from month to month. And we expected to see job losses since the U.S. Census has begun laying off the temporary workers it hired back in April and May to support its once-every-ten-years count of the American people. And we've already observed that most of the workers hired by the Census most likely fall into the Age 20-24 bracket, the only demographic group to see a dramatic surge in their representation in the U.S. workforce in the May 2010 Employment Situation report, when Census hiring activity boosted the job market.


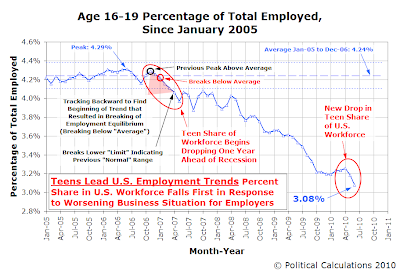
What we see with the June 2010 jobs data is that the teen share of the U.S. workforce has plunged to a new low, which we suspect coincides with the expectation of a new worsening in the future business outlook for the U.S. economy.

What we find here is that the number of teens between the ages of 16 and 19 who were counted as employed has fallen from 6,241,000 in November 2006, when they represented 4.29% of the entire U.S. workforce, to 4,286,000 as of June 2010, a percentage share of 3.08%. That's a decline of 1,955,000 teen jobs over that period, which accounts for 30.7% of all jobs lost in the U.S. economy over that same period.
With nearly two million jobs lost in less than four years, the new trend in teen jobs indicates that whatever recovery might have been taking place since October 2009 is losing steam and that the situation can be expected to become worse. How much worse remains to be seen, but for now, after clocking in with a seemingly healthy economic growth rate for the just finished second quarter of 2010, we think both U.S. GDP and the U.S. job market will trend lower well into 2011.
Labels: forecasting, jobs
Welcome to the blogosphere's toolchest! Here, unlike other blogs dedicated to analyzing current events, we create easy-to-use, simple tools to do the math related to them so you can get in on the action too! If you would like to learn more about these tools, or if you would like to contribute ideas to develop for this blog, please e-mail us at:
ironman at politicalcalculations
Thanks in advance!
Closing values for previous trading day.
This site is primarily powered by:
CSS Validation
RSS Site Feed
JavaScript
The tools on this site are built using JavaScript. If you would like to learn more, one of the best free resources on the web is available at W3Schools.com.