We normally discuss how teens are faring in the U.S. job market, mainly because they are, unlike all older individuals, the most marginal of workers in the entire U.S. economy.
 By that, we are referring to the unique combination of skills, education and experience that invariably put teens at the bottom of the employability totem pole - generally speaking, teens are simply outclassed by all older workers who have more to offer employers in the way of these three critical components of ability.
But unlike those older workers, teens have the option of staying in school and living at home with their parents who, at least until they turn 18 years old, have some amount of responsibility for providing for their upkeep. As a result, teens are much more able to disappear from the job market when economic times are tough than are older individuals.
The only working-age demographic that comes close to teens in this ability is the Age 55-64 bracket, who our site-traffic-seeking headline writers insist we call "geezers." This group, unlike all younger workers, has either a full or limited ability to transition into retirement, which eases their ability to exit from the U.S. workforce, whether by design through early retirement or by the economic hand of fate.

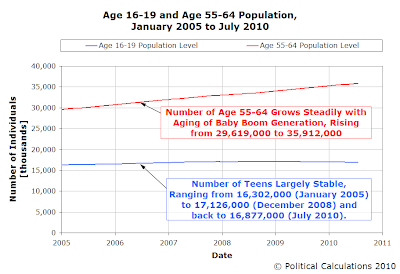
We see that the numbers of those Age 55-64 have increased steadily from 29,619,000 in January 2005 through 35,912,000 in July 2010. What we're observing here is the transition of the leading edge of the Baby Boom generation into this age bracket. We'll note here that January 2011 will mark the first time that every individual in this age bracket will have been born in the years coinciding with the U.S. baby boom following the end of World War II.
Meanwhile, we see that the number of teens is comparatively stable. Their numbers rise slowly from 16,302,000 in January 2005, peaking at 17,126,000 in December 2008, before slowly falling back to 16,877,000 in July 2010. The number of teens then has been essentially flat since January 2007, when they numbered 16,829,000 in the U.S. population.
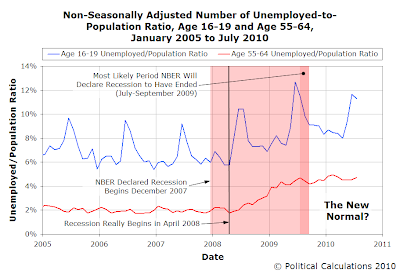
Next, let's throw the December 2007 recession into the picture and see how that affected each group's unemployment levels. To measure the impact of the recession on each demographic group, instead of considering the unemployment rate, which is the ratio of the number of unemployed and the number of individuals in each group who have been counted as being part of the labor force, we'll look at the ratio of the unemployed to the population of each demographic group. Using this ratio will give us a better sense of how the employment situation for each group might be changing with respect to each group's total population in the U.S.

Here, we find that teen unemployment/population ratios are very volatile on a seasonal basis, with unemployment spiking with summer vacations from school. By contrast, the unemployment/population ratios for the Age 55-64 population shows very little seasonal volatility.
A closer examination shows that the low end of the teen unemployment/population ratios consistently came in just below 6% in the years preceding the recession, while cranking up dramatically beginning in April 2008, some five months after the NBER's declared starting month for the economic contraction. We see that the geezer unemployment/population ratio is almost constant in this same period, typically bouncing around a very narrow range centered on 2%, before staring on an upward trajectory also beginning in April 2008.

In terms of raw numbers though, we find that instead of unemployed teens outnumbering unemployed geezers in the U.S. job market by roughly two-to-one, the two age groups now have roughly the same number of unemployed individuals.

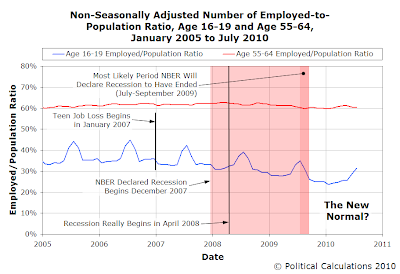
But now, things get much more interesting for teens. Here, we see that the ratio of employed teens with respect to their population was rising from 2005 through 2007, but began falling beginning in January 2007. That's especially remarkable considering that the number of teens in the U.S. was still rising at that time and also because the economy grew throughout all of 2007, before peaking in December of that year.

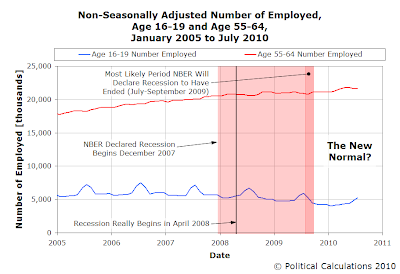
We make the same observation with the raw data showing the number of employed individuals for each age group.
Using the job data for each month of 2006 as a base reference for looking at the data for other years, we next looked at how the number of employed for each year has changed since 2006 for each age bracket.

We'll close by noting that the net number of employed individuals added over the 2006 level for the Age 55-64 group nearly matches the net number of employed individuals reduced for the Age 16-19 group.
That phenomenon should not be interpreted as meaning that geezers are taking jobs away from teens. Instead, it is much more likely a coincidence, simply given the demographic changes working their way through the U.S. workforce. Geezers, instead of chasing the jobs that are most likely to be held by teenage workers, are simply continuing to work in the jobs they've had for years - their net increase in number is due entirely to the aging of the large baby boom generation.
Meanwhile, we find that the decline of teens in the U.S. workforce is due to both the recession (after April 2008) and an apparently "mysterious" force that is blocking them from being able to even enter into the workforce that started acting in January 2007, which has made them even more marginal as workers than they were in 2006.
We say "mysterious force" even though we've long since established what it is. Not that anyone writing in the dinosaur media would choose to acknowledge it....
Image credit: Youth Sports New York
Labels: demographics, jobs
Welcome to the blogosphere's toolchest! Here, unlike other blogs dedicated to analyzing current events, we create easy-to-use, simple tools to do the math related to them so you can get in on the action too! If you would like to learn more about these tools, or if you would like to contribute ideas to develop for this blog, please e-mail us at:
ironman at politicalcalculations
Thanks in advance!
Closing values for previous trading day.
This site is primarily powered by:
CSS Validation
RSS Site Feed
JavaScript
The tools on this site are built using JavaScript. If you would like to learn more, one of the best free resources on the web is available at W3Schools.com.