It's time once again for us to stick our proverbial necks out and do our darnedest to predict where stock prices will go in the month ahead!
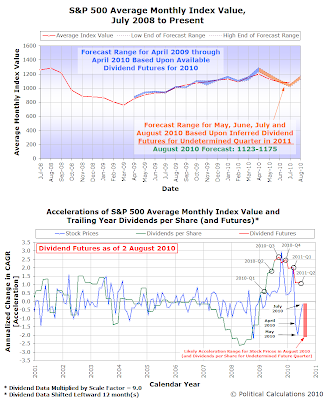
Before we get there though, it's long past time that we update our chart showing our stock price prediction track record since we first began offering regular month-ahead forecasts back in April 2009.

The difference between the two forecast zones comes down to the methods we utilized to produce the forecasts within each zone. The blue-shaded region is based upon our direct method for determining the likely range into which the average daily closing price for the S&P 500 will fall in a given month during a period of disorder in the market, for which we were able to identify the specific future quarter in time that investors had focused upon in setting stock prices, given the changes in the growth rate of dividends per share expected in that future quarter.
Meanwhile, the orange-shaded region indicates the periods during which we haven't had that data available to us to be able to make such a determination. Instead, we've been solving the inverse problem by using the changes we've observed in the growth rate of stock prices to infer what the changes in the growth rate of dividends per share would have to be to coincide with those changes, which we've assumed applies for a future quarter in time beyond the dividend futures data we have had available to us, and which we've then used to create our forecast for where stock prices will go.
Our second chart shows what we've documented for the changes in both dividends per share and stock prices that we've observed through 2 August 2010.
As you might expect, our inverse method would appear to be more subject to larger errors in our forecasts than our direct method. We've also noted that the amount of noise in the stock markets has also been greater during this period, which also contributes to the larger errors that we've recorded between our forecast ranges and where stock prices have gone. Most specifically, this applies to the so-called "flash crash" that occurred at 2:45 PM on 6 May 2010, but would also apply to the earnings-driven rallies that have taken place beginning in July 2010 should these not be backed by corresponding increases in future cash dividends.
Unfortunately for us, the dividend futures data we currently have available only extends through the second quarter of 2011, where we think investors may have instead focused their attention on how the growth rate of dividends per share will be changing further beyond that point in time. As a result, we will have to use our inverse method to anticipate where stock prices will go in August 2010.
Here, we anticipate that the average daily closing prices of the S&P 500 in August 2010 will fall into a range between 1123 and 1175.
At least for now. One thing we observed with our forecast for July 2010 is that stock prices did indeed drop into the original range we had predicted during the first third of the month, then began rising to reach where our model would have forecast they would be next (which we thought would be August), using the dividend futures data we had available at the beginning of July and assuming that stock prices would hit the middle of our originally forecast range in July.
So, just for fun, and in case the market gets ahead of our model in just the same way again during this month, we'll share where our model says stocks will go next (which we've labeled as "September" in our notes!): we should see the S&P 500 average between 1074 and 1127.
Or not really. After all, the further forward ahead we look in time using either of the methods we've used regularly since April 2009, the less accurate our forecast should be.
At least, that's our own expectation during these dog days of summer!
Labels: chaos, forecasting, SP 500
Welcome to the blogosphere's toolchest! Here, unlike other blogs dedicated to analyzing current events, we create easy-to-use, simple tools to do the math related to them so you can get in on the action too! If you would like to learn more about these tools, or if you would like to contribute ideas to develop for this blog, please e-mail us at:
ironman at politicalcalculations
Thanks in advance!
Closing values for previous trading day.
This site is primarily powered by:
CSS Validation
RSS Site Feed
JavaScript
The tools on this site are built using JavaScript. If you would like to learn more, one of the best free resources on the web is available at W3Schools.com.