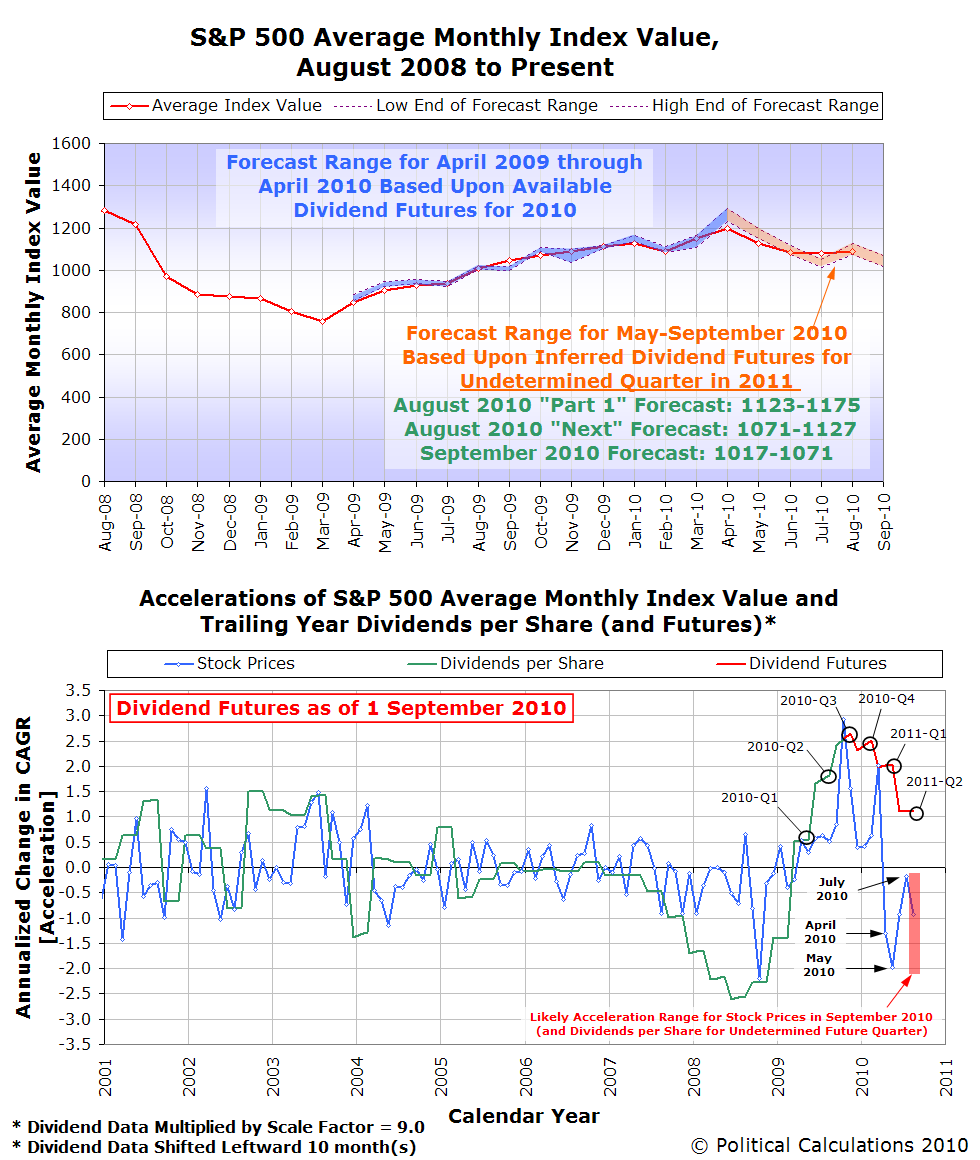
At the beginning of August 2010, we used our model of the S&P 500 to make three predictions of where stock prices would go during the month. We predicted:
- The level the S&P 500 would average in the early part of the month (1123-1175).
- The average level of stock prices to which the S&P 500 would go next (1074-1127).
- The change in the year-over-year growth rate of stock prices that would be observed during the month (-0.175 to -1.979).
 The outcomes were:
- The average of the S&P 500's daily closing prices ranged between 1,123.16 and 1,125.86 from 2 August 2010 through 10 August 2010.
- Measured from when the S&P 500 peaked at 1027.79 on 9 August 2010, the average daily closing stock price for the S&P 500 through the remainder of August was 1076.42. The entire month of August saw the average of daily closing prices for the S&P 500 clock in at 1087.28.
- The change in the year-over-year growth rate of stock prices that would be observed during the month was -0.924.
For September 2010, we're once again inferring from stock prices that investors expect that the stock market will return lower dividends in the future, which for stock prices in September mainly means flat-to-lower stock prices. Our model would place the likely range for the average of the S&P 500's daily closing stock prices during the month to be between 1017 and 1071.
We're not going to offer a "where stock prices would go next" forecast since it's not much different (that forecast, tentatively labeled as "October" in our notes is slightly lower.)
We're also coming up on when companies will be most likely to be revising their forward-looking guidance for the end of the year and when we should start getting dividend futures data extending into September 2011.
Speaking of which, S&P's Howard Silverblatt has picked up on a change in momentum where stock market earnings are concerned, which he currently has noted in the S&P 500 Monthly Performance Data (free, registration required) in the S&P 500 Earnings and Estimates spreadsheet:
Q3, Q4 and 2011 have started to decline.
Second half economic reports and corporate guidance pointing to a slowdown; top-down still pessimistic, with bottom-up slightly down over the last week
No Sales Means No Jobs Means No Recovery http://tinyurl.com/347zy98
And on that cheery note, we'll borrow a line from Captain Capitalism and say "enjoy the decline!" We're really not that pessimistic (and honestly, only Captain Capitalism could be), but as long as we're there, we figure we might as well go all out!
Labels: forecasting, SP 500
Welcome to the blogosphere's toolchest! Here, unlike other blogs dedicated to analyzing current events, we create easy-to-use, simple tools to do the math related to them so you can get in on the action too! If you would like to learn more about these tools, or if you would like to contribute ideas to develop for this blog, please e-mail us at:
ironman at politicalcalculations
Thanks in advance!
Closing values for previous trading day.
This site is primarily powered by:
CSS Validation

RSS Site Feed
JavaScript
The tools on this site are built using JavaScript. If you would like to learn more, one of the best free resources on the web is available at W3Schools.com.
Other Cool Resources
Blog Roll


