Political Calculations
November 18, 2010

Let's begin with a quote today, shall we?

A weak economy, new tax breaks, and aggressive tax sheltering have pushed corporate income tax receipts down to historically low levels, both relative to the size of the economy and as a share of total federal revenues. According to the most recent budget projections of the Congressional Budget Office, corporate revenues will remain at historically low levels even after the economy recovers, and even if the large new corporate tax breaks enacted in 2002 and 2003 are allowed to expire on schedule.

That's an excerpt from an 18-page report produced by the Center on Budget and Policy Priorities. In 2003. Really. And here we are, just over seven years later, and it might as well have been written today.

And it would still be a total crock. In reality, this kind of assertion is based on the old magician's trick of misdirection. "Look here," the master of deception commands, "as I waive my magic laser pointer at the following chart, and you will see with your own eyes that corporate income tax revenues have fallen over time!"

U.S. Corporate Federal Income Tax Collections as a Percentage Share of GDP, 1946-2009

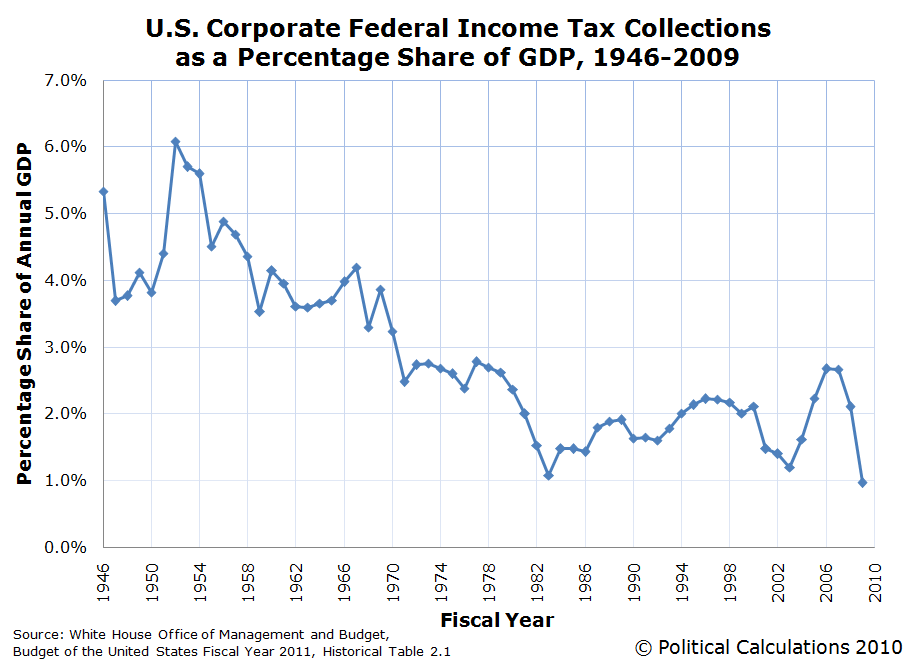
And so it would seem. But do you see the misdirection in what our charming conjurer has said?

The deceit lies in the words "corporate income tax revenues", which you, as a casual observer (aka "the mark"), are meant to take as being the only kind of taxes that corporations and all other businesses pay into the U.S. Treasury's coffers. The con would then continue as our trickster would go on to blame special tax breaks and loopholes as being the major reasons why corporate tax collections have fallen so far over time, not to mention those evil tax cuts lobbied for by those fat cat multinational corporations.

But that completely ignores that the other taxes that all businesses pay have steadily risen over that same period of time, whether by major corporations or limited liability companies or partnerships or even sole proprietors. Which you might not have noticed because you don't see them being paid by corporate America because they're in the background of the magician's stage, so to speak. As it happens, they're the employers' portion of the federal government's payroll taxes, which go by names like "Social Security" and "Medicare", or more simply, "FICA":

U.S. Employers' Portion of Federal Payroll Taxes as a Percentage Share of GDP, 1946-2009

And just as surely as you see the deductions for these things on your own paycheck, you can rest assured that your employer has cut a separate check directly to the U.S. Treasury for the same amount. These payments account for one-half of the total amount of payroll taxes collected in every year.

Which brings us to our final chart, in which we reveal just how much the federal government has collected from all of American business as a percent share of GDP since 1946:

Total Federal Tax Collections Paid by Businesses as a Percentage Share of GDP, 1946-2009

We've added the statistical control chart indicators to demonstrate just how consistent the full share of federal taxes paid by American businesses has been over that time. We find the long-term stable average of total corporate tax collections is 5.26% of annual GDP, with a standard deviation of 0.56% of GDP.

Now here's the real story behind that steady picture. Because the U.S. Congress has increased those payroll taxes over time to deal with the problem of a growing population of future beneficiaries for the programs supported by those payroll taxes, they've had to offset what would otherwise be a sharply increased tax burden on American businesses by reducing corporate income taxes. Otherwise, a large number of American businesses would have become completely noncompetitive in the global economy.

Sometimes, they've done that directly by cutting the corporate income tax rates, but mostly, elected politicians have found that it is more profitable for themselves to complicate the tax code by creating special loopholes that allow the various businesses they favor to avoid paying those taxes. Legally.

This might be one of those very rare situations where the outcome has turned out to be fair on whole, but all the means by which we get there are about as dirty as they can be. Which might make it a unique case study for public choice theory.

Data Sources

Tax Receipts by Source: White House Office of Management and Budget. Budget of the United States Fiscal Year 2011. Table 2.1 - Receipts by Source, 1934-2015.

GDP: White House Office of Management and Budget. Budget of the United States Fiscal Year 2011. Table 1.2 - Summary of Receipts, Outlays and Surpluses or Deficits (-) as Percentages of GDP: 1930-2015.

Elsewhere

Update: Tom Blumer fills in the gap for what actually happened with corporate tax collections between 2003 and today.

Labels: , ,


<< Home
Unexpectedly Intriguing!

About Political Calculations


blog advertising
is good for you

Welcome to the blogosphere's toolchest! Here, unlike other blogs dedicated to analyzing current events, we create easy-to-use, simple tools to do the math related to them so you can get in on the action too! If you would like to learn more about these tools, or if you would like to contribute ideas to develop for this blog, please e-mail us at:

ironman at politicalcalculations.com

Thanks in advance!

Recent Posts

Statistically-Bounded Federal Tax Receipt Data

The Deficit Commission's Plan for Personal Income ...

The Skyrocketing Compensation of Federal Employees...

On the Moneyed Midways - November 12, 2010

Shakespeare, Performed in Shakespeare's Own Accent...

Going Inside the VAT

From Our Inbox

Older Workers' Jobs Shellacked in October

On the Moneyed Midways - November 5, 2010

Completing the Loop, Take 2, Part 2

Elsewhere on the Web

This year, we'll be experimenting with a number of apps to bring more of a current events focus to Political Calculations - we're test driving the app(s) below!

Most Popular Posts

The S&P 500 at Your Fingertips

The Distribution of Income for 2010: Individuals

Should You Trade in Your Gas Guzzler?

What Are the Chances Your Marriage Will Last?

Tipping Around the World

What's Your Body Fat Percentage?

The Odds of Dying, Again!

Gas Prices, the Unemployment Rate, and Desperation

Hauser's Law

The Real Story Behind "Rising" U.S. Income Inequality

Quick Index

First Time Visitor to Political Calculations?

On the Moneyed Midways

A Lot, But Not All, of Our Tools

U.S. GDP Temperature Gauge

Political Calculations' GDP Temperature Gauge, 2013Q1 First Estimate Political Calculations' U.S. GDP Temperature Gauge provides a means to quickly evaluate the growth rate of the U.S. economy against the backdrop of how the economy has performed since 1980, with the "temperature" color spectrum ranging from a recessionary "cold" (purple) through an expansionary "hot" (red).

The GDP Temperature Gauge presents both the annualized GDP growth rate as reported by the U.S. Bureau of Economic Analysis reports for a one-quarter period and also as averaged over a two quarter period, which smooths out the volatility seen in the one-quarter data and provides a better indication of the relative strength of the U.S. economy over time.

Site Data

This site is primarily powered by:

This page is powered by Blogger. Isn't yours?

Visitors since December 6, 2004:

CSS Validation

Valid CSS!

RSS Site Feed

AddThis Feed Button

JavaScript

The tools on this site are built using JavaScript. If you would like to learn more, one of the best free resources on the web is available at W3Schools.com.

Other Cool Resources

ZunZun - Exceptional regression analysis tool.
Wolfram Integrator - Solve integrals. Do calculus!
Create a Graph - Easy-to-use basic graph-making tool.
Many Eyes - Data visualization extraordinaire!
Wolfram Alpha - Computational knowledge engine.
Khan Academy - Math & science video mini-lectures!
Picasion - Animate images.


Archives
December 2004
January 2005
February 2005
March 2005
April 2005
May 2005
June 2005
July 2005
August 2005
September 2005
October 2005
November 2005
December 2005
January 2006
February 2006
March 2006
April 2006
May 2006
June 2006
July 2006
August 2006
September 2006
October 2006
November 2006
December 2006
January 2007
February 2007
March 2007
April 2007
May 2007
June 2007
July 2007
August 2007
September 2007
October 2007
November 2007
December 2007
January 2008
February 2008
March 2008
April 2008
May 2008
June 2008
July 2008
August 2008
September 2008
October 2008
November 2008
December 2008
January 2009
February 2009
March 2009
April 2009
May 2009
June 2009
July 2009
August 2009
September 2009
October 2009
November 2009
December 2009
January 2010
February 2010
March 2010
April 2010
May 2010
June 2010
July 2010
August 2010
September 2010
October 2010
November 2010
December 2010
January 2011
February 2011
March 2011
April 2011
May 2011
June 2011
July 2011
August 2011
September 2011
October 2011
November 2011
December 2011
January 2012
February 2012
March 2012
April 2012
May 2012
June 2012
July 2012
August 2012
September 2012
October 2012
November 2012
December 2012
January 2013
February 2013
March 2013
April 2013
May 2013

Blog Roll

Bloodhoundblog
Budgets Are Sexy
Cafe Hayek
Carpe Diem
Core77
Coyote Blog
Craig Harper
Darwin's Finance
Digerati Life, The
Division of Labour
Dough Roller, The
Eclectecon
Econlog
Economics Roundtable
EconomicsUK
Environmental Economics
Escape from Cubicle Nation
Execupundit
FiscalGeek
Get Rich Slowly
Gongol
Good Financial Cents
HR Bartender
Hot Air
i4cp Productivity
Innocent Bystanders
Innovation and Growth
Instapundit
Intangible Economy
I've Paid Twice for This Already
Joanne Jacobs
Kaus Files
Len Penzo dot Com
Making Ripples
Market Power
Mechonomics
Mighty Bargain Hunter
Monevator
My Dollar Plan
New Economist
Newmark's Door
Nina Simosko
Physorg
Private Sector Development
Real Clear Politics
Richard Fernandez
Roger L. Simon
Rowan Manahan
Sound Politics
SOX First
Sports Economist, The
squawkfox
Three Star Leadership
Tim Worstall
Townhall
Trusted Advisor
Uncommon Misperceptions
voluntaryXchange
WILLisms
Winterspeak

Market Links

Big Picture, The
Crackerjack Finance
CXO Advisory Group
Disciplined Approach to Investing
Dividend Guy, The
Doug Short
Evidence Investing
Fat Pitch Financials
FX Investment Strategies
Oilprice

Charities We Support

American Red Cross
Children's Heart Foundation
Salvation Army
SMA Foundation

Recommended Reading

Kindle Paperwhite 3G - Best e-reader!
Angel in the Whirlwind
Bailout Nation
Cartoon Guide to Statistics
A Comprehensive Guide to the Peloponnesian War
The Complete Personal Memoirs of Ulysses S. Grant
The Count of Monte Cristo
Ender's Game
Gardner's Art Through the Ages
Empire of Wealth
How to Make Presentations to Councils and Boards
Juran's Quality Handbook
Marks' Standard Handbook
The Second World War
Stocks for the Long Run
Why Smart Executives Fail

Recommended Viewing

The Tudors: The Complete Series

Recently Shopped

Kindle Fire HD 8.9" 4G LTE Wireless 32 GB
Snap Circuits Jr. SC-100
Nerf Vortex Praxis
Sony BRAVIA 40" LED HDTV
2540 Series Docking Station
New Balance MX623
Dunham Men's Waterproof Oxford
TN360 Black Toner Cartridge
The Dangerous Book for Boys
Air Swimmer Remote Control Inflatable Flying Shark
Fisher-Price Little People Lil Pirate Ship

Seeking Alpha Certified